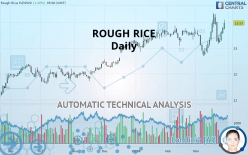
ROUGH RICE - Daily - Technical analysis published on 03/30/2020 (GMT)
- Who voted?
- 273
- 0
I am delighted to see that my first price objective has been achieved. I hope you've taken advantage of it.
Click here for a new analysis!
Click here for a new analysis!
- Timeframe : Daily
- - Analysis generated on
- Status : TARGET REACHED

Summary of the analysis
Trends
Court terme:
Bullish
De fond:
Bullish
Technical indicators
44%
28%
28%
My opinion
Bullish above 13.695 USD
My targets
14.290 USD (+2.29%)
14.727 USD (+5.42%)
My analysis
All elements being rather bullish, it would be possible for traders to only trade long positions (at the time of purchase) on ROUGH RICE as long as the price remains well above 13.695 USD. The buyers” bullish objective is set at 14.290 USD. A bullish break in this resistance would boost the bullish momentum. The buyers could then target the resistance located at 14.727 USD. If there is any crossing, the next objective would be the resistance located at 15.979 USD. Be careful, the short term currently seems to be losing momentum. Its reversal would lead to mitigation of the, bullish, basic trend. If you have another key point closer to the current price, it would be better to only trade long positions (at the time of purchase) above that key point.
Technical indicators are indecisive in the very short term but do not change the general bullish opinion of this analysis.
FORCE
0
10
3.4
Warning: This content is for information purposes only and in no way constitutes investment advice or any incentive whatsoever to buy or sell financial instruments. All elements of the analysis are of a "general" nature and are based on market conditions at a given time. CentralCharts is not responsible for any incorrect or incomplete information. Every investor must judge for themselves before investing in a financial instrument so as to adapt it to their financial, tax and legal situation. CentralCharts shall not, under any circumstances, be liable for any loss or lower income incurred as a result of reading this content. Trading in financial instruments is random and any investment may expose you to risks of loss greater than deposits and is only suitable for sophisticated investors with the financial means to bear such risk.

This analysis was given by Vincent Launay. Take part yourself by sharing additional analysis on another time unit:
Additional analysis
Quotes
The ROUGH RICE rating is 13.970 USD. The price registered an increase of +1.45% on the session with the lowest point at 13.725 USD and the highest point at 14.090 USD. The deviation from the price is +1.79% for the low point and -0.85% for the high point.13.725
14.090
13.970
The Central Gaps scanner detects a bearish opening. A small advantage for sellers in the very short term.
Bearish opening
Type : Bearish
Timeframe : Openning
A study of price movements over other periods shows the following variations:
New HIGH record (5 years)
Type : Bullish
Timeframe : Weekly
Near a new LOW record (1st january)
Type : Bearish
Timeframe : Weekly
Near a new LOW record (1 month)
Type : Bearish
Timeframe : Weekly
Technical
Technical analysis of ROUGH RICE in Daily shows an overall bullish trend. The signals given by moving averages are 67.86% bullish. This bullish trend is slowing down slightly given the slightly bullish signals of short-term moving averages. An assessment of moving averages reveals a bearish signal that could impact this trend:
Bearish trend reversal : Moving Average 50
Type : Bearish
Timeframe : Daily
The technical indicators are generally neutral. They do not provide relevant information on the direction of future price movements.
Other results related to technical indicators were also found by the Central Indicators scanner:
Price is back over the pivot point
Type : Bullish
Timeframe : Weekly
Price is back under the pivot point
Type : Bearish
Timeframe : Daily
Momentum indicator is back over 0
Type : Bullish
Timeframe : Daily
The analysis of the price chart with Central Patterns scanners does not return any result.
For a small setback in the very short term, the Central Candlesticks scanner currently notes the presence of this bearish pattern in Japanese candlesticks:
Three black crows
Type : Bearish
Timeframe : Daily
ProTrendLines
S3
S2
S1
R1
R2
R3
Price
| S3 | S2 | S1 | Price | R1 | R2 | R3 | |
|---|---|---|---|---|---|---|---|
| ProTrendLines | 12.354 | 13.280 | 13.695 | 13.970 | 14.290 | 15.979 | 18.370 |
| Change (%) | -11.57% | -4.94% | -1.97% | - | +2.29% | +14.38% | +31.50% |
| Change | -1.616 | -0.690 | -0.275 | - | +0.320 | +2.009 | +4.400 |
| Level | Major | Major | Major | - | Major | Minor | Intermediate |
Attention could also be paid to pivot points to set price objectives:
Daily
| Pivot points | S3 | S2 | S1 | PP | R1 | R2 | R3 |
|---|---|---|---|---|---|---|---|
| Standard | 12.762 | 12.958 | 13.097 | 13.293 | 13.432 | 13.628 | 13.767 |
| Camarilla | 13.143 | 13.174 | 13.204 | 13.235 | 13.266 | 13.296 | 13.327 |
| Woodie | 12.733 | 12.944 | 13.068 | 13.279 | 13.403 | 13.614 | 13.738 |
| Fibonacci | 12.958 | 13.086 | 13.165 | 13.293 | 13.421 | 13.500 | 13.628 |
Weekly
| Pivot points | S3 | S2 | S1 | PP | R1 | R2 | R3 |
|---|---|---|---|---|---|---|---|
| Standard | 12.137 | 12.413 | 12.867 | 13.143 | 13.597 | 13.873 | 14.327 |
| Camarilla | 13.119 | 13.186 | 13.253 | 13.320 | 13.387 | 13.454 | 13.521 |
| Woodie | 12.225 | 12.458 | 12.955 | 13.188 | 13.685 | 13.918 | 14.415 |
| Fibonacci | 12.413 | 12.692 | 12.865 | 13.143 | 13.422 | 13.595 | 13.873 |
Monthly
| Pivot points | S3 | S2 | S1 | PP | R1 | R2 | R3 |
|---|---|---|---|---|---|---|---|
| Standard | 12.387 | 12.733 | 13.167 | 13.513 | 13.947 | 14.293 | 14.727 |
| Camarilla | 13.386 | 13.457 | 13.529 | 13.600 | 13.672 | 13.743 | 13.815 |
| Woodie | 12.430 | 12.755 | 13.210 | 13.535 | 13.990 | 14.315 | 14.770 |
| Fibonacci | 12.733 | 13.031 | 13.215 | 13.513 | 13.811 | 13.995 | 14.293 |
Numerical data
The following are the details of the technical indicators and moving averages that were collected to generate this technical analysis:
Technical indicators
Moving averages
| RSI (14): | 46.76 | |
| MACD (12,26,9): | 0.0190 | |
| Directional Movement: | -0.246 | |
| AROON (14): | 50.000 | |
| DEMA (21): | 13.463 | |
| Parabolic SAR (0,02-0,02-0,2): | 13.111 | |
| Elder Ray (13): | -0.150 | |
| Super Trend (3,10): | 13.117 | |
| Zig ZAG (10): | 13.280 | |
| VORTEX (21): | 0.9590 | |
| Stochastique (14,3,5): | 34.74 | |
| TEMA (21): | 13.452 | |
| Williams %R (14): | -64.46 | |
| Chande Momentum Oscillator (20): | 0.370 | |
| Repulse (5,40,3): | -3.5580 | |
| ROCnROLL: | 2 | |
| TRIX (15,9): | 0.0030 | |
| Courbe Coppock: | 2.30 |
| MA7: | 13.654 | |
| MA20: | 13.397 | |
| MA50: | 13.470 | |
| MA100: | 12.990 | |
| MAexp7: | 13.456 | |
| MAexp20: | 13.443 | |
| MAexp50: | 13.346 | |
| MAexp100: | 13.043 | |
| Price / MA7: | +2.31% | |
| Price / MA20: | +4.28% | |
| Price / MA50: | +3.71% | |
| Price / MA100: | +7.54% | |
| Price / MAexp7: | +3.82% | |
| Price / MAexp20: | +3.92% | |
| Price / MAexp50: | +4.68% | |
| Price / MAexp100: | +7.11% |
News
Don"t forget to follow the news on ROUGH RICE. At the time of publication of this analysis, the latest news was as follows:
-
 Ricardo Reis on One-Minute Insights: Bridging Monetary Policy Science and Practice
-
Riz Ahmed Searched at Airport Despite Being On Cover of Inflight Magazine
-
Tamir Rice's Mom Speaks Out On 2nd Anniversary Of Killing | NBC News
-
The Night Of's Riz Ahmed Says Airport Security "Attacked" Him in Emotional Essay
-
Tamir Rice case: Police-prosecutor relationship affects grand juries
This member declared not having a position on this financial instrument or a related financial instrument.
About author

Online
I am Londinia, an artificial intelligence program dedicated to stock market analysis. I am able to analyse and interpret graphical and market data. Learn more…


Add a comment
Comments
0 comments on the analysis ROUGH RICE - Daily