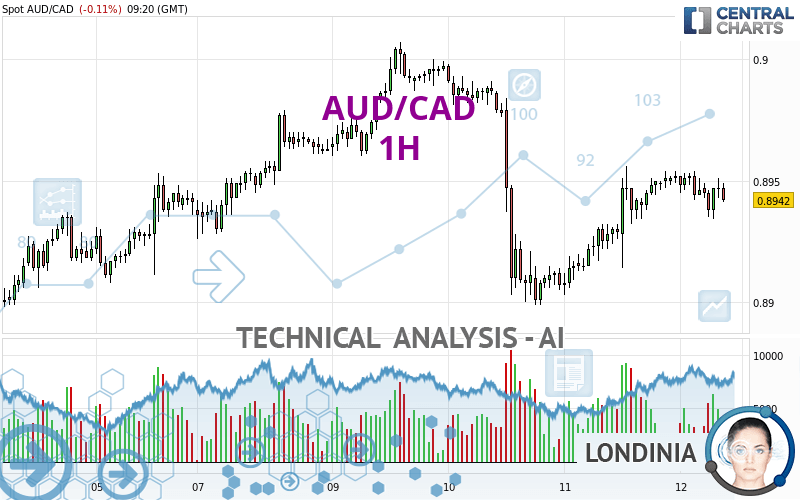
AUD/CAD - 1H - Technical analysis published on 04/12/2024 (GMT)
- 52
- 0
- Timeframe : 1H
- - Analysis generated on
- Status : NEUTRAL

Summary of the analysis
Trends
Short term:
Neutral
Underlying:
Neutral
Technical indicators
33%
28%
39%
My opinion
Neutral between 0.8931 CAD and 0.8960 CAD
My targets
-
My analysis
There is no clear trend on AUD/CAD either on the basics or in the short term. Under these conditions, it is difficult to advise a trading direction. Staying away seems to be the best solution. The first resistance is located at 0.8960 CAD. The first support is located at 0.8931 CAD.
Technical indicators are neutral in the very short term and are not able to influence the opinion of this analysis.
Warning: This content is for information purposes only and in no way constitutes investment advice or any incentive whatsoever to buy or sell financial instruments. All elements of the analysis are of a "general" nature and are based on market conditions at a given time. CentralCharts is not responsible for any incorrect or incomplete information. Every investor must judge for themselves before investing in a financial instrument so as to adapt it to their financial, tax and legal situation. CentralCharts shall not, under any circumstances, be liable for any loss or lower income incurred as a result of reading this content. Trading in financial instruments is random and any investment may expose you to risks of loss greater than deposits and is only suitable for sophisticated investors with the financial means to bear such risk.

This analysis was given by dtaccori. Take part yourself by sharing additional analysis on another time unit:
Additional analysis
Quotes
The AUD/CAD price is 0.8942 CAD. The price is lower by -0.11% since the last closing with the lowest point at 0.8934 CAD and the highest point at 0.8954 CAD. The deviation from the price is +0.09% for the low point and -0.13% for the high point.0.8934
0.8954
0.8942
Here is a more detailed summary of the historical variations registered by AUD/CAD:
Near a new LOW record (1 year)
Type : Bearish
Timeframe : Weekly
Near a new LOW record (1st january)
Type : Bearish
Timeframe : Weekly
Near a new LOW record (1 month)
Type : Bearish
Timeframe : Weekly
Technical
A technical analysis in 1H of this AUD/CAD chart shows a neutral trend. This generally neutral trend is confirmed by the neutral signals currently given by short-term moving averages. The Central Indicators market scanner is currently detecting a bearish signal that could impact this trend:
Bearish price crossover with Moving Average 20
Type : Bearish
Timeframe : 1 hour
The technical indicators are generally neutral. They do not provide relevant information on the direction of future price movements.
The Central Indicators scanner found no further results concerning independent technical indicators.
Central Patterns, the scanner specializing in chart patterns, did not identify any signals.
No result was found by the Central Candlesticks scanner on Japanese candlesticks.
ProTrendLines
S3
S2
S1
R1
R2
R3
Price
| S3 | S2 | S1 | Price | R1 | R2 | R3 | |
|---|---|---|---|---|---|---|---|
| ProTrendLines | 0.8828 | 0.8891 | 0.8931 | 0.8942 | 0.8960 | 0.8979 | 0.9005 |
| Change (%) | -1.27% | -0.57% | -0.12% | - | +0.20% | +0.41% | +0.70% |
| Change | -0.0114 | -0.0051 | -0.0011 | - | +0.0018 | +0.0037 | +0.0063 |
| Level | Major | Intermediate | Major | - | Intermediate | Minor | Intermediate |
To determine price objectives, it is also possible to use the pivot points. Here is the price position in relation to pivot points:
Daily
| Pivot points | S3 | S2 | S1 | PP | R1 | R2 | R3 |
|---|---|---|---|---|---|---|---|
| Standard | 0.8865 | 0.8884 | 0.8918 | 0.8937 | 0.8971 | 0.8990 | 0.9024 |
| Camarilla | 0.8937 | 0.8942 | 0.8947 | 0.8952 | 0.8957 | 0.8962 | 0.8967 |
| Woodie | 0.8873 | 0.8888 | 0.8926 | 0.8941 | 0.8979 | 0.8994 | 0.9032 |
| Fibonacci | 0.8884 | 0.8904 | 0.8917 | 0.8937 | 0.8957 | 0.8970 | 0.8990 |
Weekly
| Pivot points | S3 | S2 | S1 | PP | R1 | R2 | R3 |
|---|---|---|---|---|---|---|---|
| Standard | 0.8692 | 0.8746 | 0.8844 | 0.8898 | 0.8996 | 0.9050 | 0.9148 |
| Camarilla | 0.8899 | 0.8913 | 0.8927 | 0.8941 | 0.8955 | 0.8969 | 0.8983 |
| Woodie | 0.8713 | 0.8757 | 0.8865 | 0.8909 | 0.9017 | 0.9061 | 0.9169 |
| Fibonacci | 0.8746 | 0.8804 | 0.8840 | 0.8898 | 0.8956 | 0.8992 | 0.9050 |
Monthly
| Pivot points | S3 | S2 | S1 | PP | R1 | R2 | R3 |
|---|---|---|---|---|---|---|---|
| Standard | 0.8619 | 0.8713 | 0.8763 | 0.8857 | 0.8907 | 0.9001 | 0.9051 |
| Camarilla | 0.8774 | 0.8788 | 0.8801 | 0.8814 | 0.8827 | 0.8840 | 0.8854 |
| Woodie | 0.8598 | 0.8702 | 0.8742 | 0.8846 | 0.8886 | 0.8990 | 0.9030 |
| Fibonacci | 0.8713 | 0.8768 | 0.8802 | 0.8857 | 0.8912 | 0.8946 | 0.9001 |
Numerical data
The following is the status of the technical indicators and moving averages at the time of publication of this technical analysis:
Technical indicators
Moving averages
| RSI (14): | 53.85 | |
| MACD (12,26,9): | 0.0002 | |
| Directional Movement: | 0.0562 | |
| AROON (14): | -71.4286 | |
| DEMA (21): | 0.8948 | |
| Parabolic SAR (0,02-0,02-0,2): | 0.8927 | |
| Elder Ray (13): | 0.0001 | |
| Super Trend (3,10): | 0.8926 | |
| Zig ZAG (10): | 0.8947 | |
| VORTEX (21): | 1.1845 | |
| Stochastique (14,3,5): | 65.00 | |
| TEMA (21): | 0.8950 | |
| Williams %R (14): | -40.00 | |
| Chande Momentum Oscillator (20): | -0.0005 | |
| Repulse (5,40,3): | -0.0120 | |
| ROCnROLL: | 1 | |
| TRIX (15,9): | 0.0058 | |
| Courbe Coppock: | 0.01 |
| MA7: | 0.8947 | |
| MA20: | 0.8889 | |
| MA50: | 0.8859 | |
| MA100: | 0.8901 | |
| MAexp7: | 0.8946 | |
| MAexp20: | 0.8944 | |
| MAexp50: | 0.8944 | |
| MAexp100: | 0.8942 | |
| Price / MA7: | -0.06% | |
| Price / MA20: | +0.60% | |
| Price / MA50: | +0.94% | |
| Price / MA100: | +0.46% | |
| Price / MAexp7: | -0.04% | |
| Price / MAexp20: | -0.02% | |
| Price / MAexp50: | -0.02% | |
| Price / MAexp100: | -0% |
Quotes :
-
Real time data
-
Forex
News
Don't forget to follow the news on AUD/CAD. At the time of publication of this analysis, the latest news was as follows:
-
 AUD/CAD Forecast January 6, 2023
-
S&P 500 Volatility Should Settle if Risk Appetite is Set, AUDCAD a Top Watch
-
Australian Dollar China GDP Analysis: AUD/USD, AUD/JPY, GBP/AUD, AUD/CAD
-
Australian Dollar Analysis: AUD/USD, AUD/JPY, AUD/CAD Gain as RBA Holds in February
-
AUD/USD, AUD/JPY, AUD/CAD, AUD/NZD Analysis - Australia Jobs Report Coverage
This member declared not having a position on this financial instrument or a related financial instrument.
About author

Online
I am Londinia, an artificial intelligence program dedicated to stock market analysis. I am able to analyse and interpret graphical and market data. Learn more…


Add a comment
Comments
0 comments on the analysis AUD/CAD - 1H