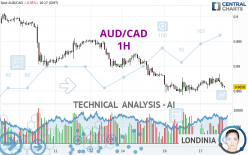
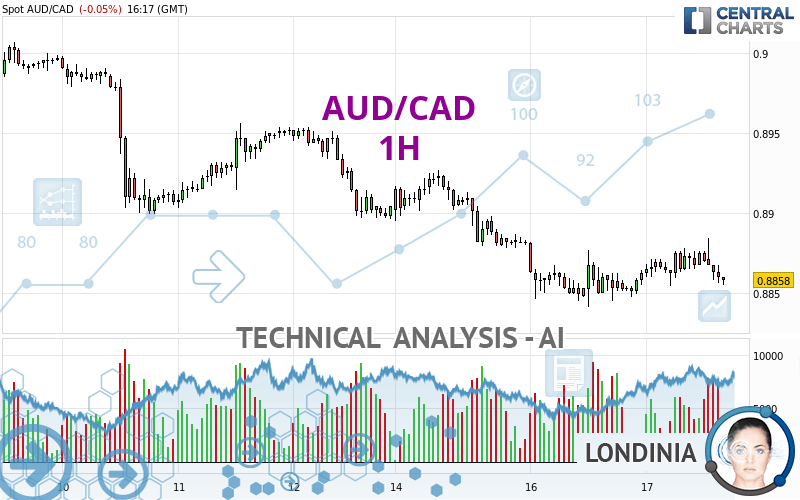
AUD/CAD - 1H - Technical analysis published on 04/17/2024 (GMT)
- 73
- 0
I am pleased to note that the threshold for invalidation has been maintained for 20 Candlesticks.
Click here for a new analysis!
Click here for a new analysis!
- Timeframe : 1H
- - Analysis generated on
- Status : LEVEL MAINTAINED
Summary of the analysis
Trends
Short term:
Bearish
Underlying:
Strongly bearish
Technical indicators
22%
56%
22%
My opinion
Bearish under 0.8877 CAD
My targets
0.8841 CAD (-0.0017)
0.8807 CAD (-0.0051)
My analysis
All elements being clearly bearish, it would be possible for traders to trade only short positions (for sale) on AUD/CAD as long as the price remains well below 0.8877 CAD. The next bearish objective for sellers is set at 0.8841 CAD. A bearish break of this support would revive the bearish momentum. The sellers could then target the support located at 0.8807 CAD. If there is any crossing, the next objective would be the support located at 0.8750 CAD. Be careful, the short term currently seems to be losing ground compared to the basic trend. Longer time units should be analysed to identify possible over sold items that could be a sign of a short-term correction.
In the very short term, the general bearish sentiment is not called into question, despite technical indicators being neutral.
Force
0
10
5.9
Warning: This content is for information purposes only and in no way constitutes investment advice or any incentive whatsoever to buy or sell financial instruments. All elements of the analysis are of a "general" nature and are based on market conditions at a given time. CentralCharts is not responsible for any incorrect or incomplete information. Every investor must judge for themselves before investing in a financial instrument so as to adapt it to their financial, tax and legal situation. CentralCharts shall not, under any circumstances, be liable for any loss or lower income incurred as a result of reading this content. Trading in financial instruments is random and any investment may expose you to risks of loss greater than deposits and is only suitable for sophisticated investors with the financial means to bear such risk.

This analysis was given by dtaccori. Take part yourself by sharing additional analysis on another time unit:
Additional analysis
Quotes
AUD/CAD rating 0.8858 CAD. On the day, this instrument lost -0.05% and was between 0.8854 CAD and 0.8884 CAD. This implies that the price is at +0.05% from its lowest and at -0.29% from its highest.0.8854
0.8884
0.8858
So that you have an overall view of the price change, here is a table showing the variations over several periods:
Near a new LOW record (1 year)
Type : Bearish
Timeframe : Weekly
Near a new HIGH record (1st january)
Type : Bullish
Timeframe : Weekly
Near a new HIGH record (1 month)
Type : Bullish
Timeframe : Weekly
Technical
Technical analysis of AUD/CAD in 1H shows a overall strongly bearish trend. The signals given by moving averages are 82.14% bearish. This strongly bearish trend seems to be slowing down given the slightly bearish signals being given by short-term moving averages. The Central Indicators scanner detects a bullish signal on moving averages that could impact this trend:
Moving Average bullish crossovers : MA20 & MA50
Type : Bullish
Timeframe : 1 hour
In fact, of the 18 technical indicators analysed by Central Analyzer, 4 are bullish, 4 are neutral and 10 are bearish. But beware of excesses. The Central Indicators scanner currently detects this:
CCI indicator is oversold : under -100
Type : Neutral
Timeframe : 1 hour
Williams %R indicator is oversold : under -80
Type : Neutral
Timeframe : 1 hour
Pivot points : price is under support 1
Type : Neutral
Timeframe : Weekly
MACD indicator is back under 0
Type : Bearish
Timeframe : 1 hour
Central Patterns, the market scanner focusing on chart patterns, resistances and supports found this result:
Near resistance of channel
Type : Bearish
Timeframe : 1 hour
No result was found by the Central Candlesticks scanner on Japanese candlesticks.
ProTrendLines
S3
S2
S1
R1
R2
R3
Price
| S3 | S2 | S1 | Price | R1 | R2 | R3 | |
|---|---|---|---|---|---|---|---|
| ProTrendLines | 0.8750 | 0.8807 | 0.8841 | 0.8858 | 0.8877 | 0.8891 | 0.8937 |
| Change (%) | -1.22% | -0.58% | -0.19% | - | +0.21% | +0.37% | +0.89% |
| Change | -0.0108 | -0.0051 | -0.0017 | - | +0.0019 | +0.0033 | +0.0079 |
| Level | Major | Intermediate | Intermediate | - | Intermediate | Minor | Major |
Attention could also be paid to pivot points to set price objectives:
Daily
| Pivot points | S3 | S2 | S1 | PP | R1 | R2 | R3 |
|---|---|---|---|---|---|---|---|
| Standard | 0.8800 | 0.8821 | 0.8841 | 0.8862 | 0.8882 | 0.8903 | 0.8923 |
| Camarilla | 0.8851 | 0.8855 | 0.8858 | 0.8862 | 0.8866 | 0.8870 | 0.8873 |
| Woodie | 0.8801 | 0.8821 | 0.8842 | 0.8862 | 0.8883 | 0.8903 | 0.8924 |
| Fibonacci | 0.8821 | 0.8836 | 0.8846 | 0.8862 | 0.8877 | 0.8887 | 0.8903 |
Weekly
| Pivot points | S3 | S2 | S1 | PP | R1 | R2 | R3 |
|---|---|---|---|---|---|---|---|
| Standard | 0.8753 | 0.8825 | 0.8864 | 0.8936 | 0.8975 | 0.9047 | 0.9086 |
| Camarilla | 0.8874 | 0.8884 | 0.8894 | 0.8904 | 0.8914 | 0.8924 | 0.8935 |
| Woodie | 0.8738 | 0.8817 | 0.8849 | 0.8928 | 0.8960 | 0.9039 | 0.9071 |
| Fibonacci | 0.8825 | 0.8867 | 0.8893 | 0.8936 | 0.8978 | 0.9004 | 0.9047 |
Monthly
| Pivot points | S3 | S2 | S1 | PP | R1 | R2 | R3 |
|---|---|---|---|---|---|---|---|
| Standard | 0.8619 | 0.8713 | 0.8763 | 0.8857 | 0.8907 | 0.9001 | 0.9051 |
| Camarilla | 0.8774 | 0.8788 | 0.8801 | 0.8814 | 0.8827 | 0.8840 | 0.8854 |
| Woodie | 0.8598 | 0.8702 | 0.8742 | 0.8846 | 0.8886 | 0.8990 | 0.9030 |
| Fibonacci | 0.8713 | 0.8768 | 0.8802 | 0.8857 | 0.8912 | 0.8946 | 0.9001 |
Numerical data
The following is the status of the technical indicators and moving averages at the time of publication of this technical analysis:
Technical indicators
Moving averages
| RSI (14): | 43.69 | |
| MACD (12,26,9): | -0.0001 | |
| Directional Movement: | 0.2390 | |
| AROON (14): | 57.1428 | |
| DEMA (21): | 0.8864 | |
| Parabolic SAR (0,02-0,02-0,2): | 0.8883 | |
| Elder Ray (13): | -0.0008 | |
| Super Trend (3,10): | 0.8879 | |
| Zig ZAG (10): | 0.8858 | |
| VORTEX (21): | 1.0198 | |
| Stochastique (14,3,5): | 21.11 | |
| TEMA (21): | 0.8867 | |
| Williams %R (14): | -90.00 | |
| Chande Momentum Oscillator (20): | -0.0007 | |
| Repulse (5,40,3): | -0.1200 | |
| ROCnROLL: | 2 | |
| TRIX (15,9): | 0.0011 | |
| Courbe Coppock: | 0.06 |
| MA7: | 0.8909 | |
| MA20: | 0.8886 | |
| MA50: | 0.8862 | |
| MA100: | 0.8897 | |
| MAexp7: | 0.8864 | |
| MAexp20: | 0.8865 | |
| MAexp50: | 0.8871 | |
| MAexp100: | 0.8887 | |
| Price / MA7: | -0.57% | |
| Price / MA20: | -0.32% | |
| Price / MA50: | -0.05% | |
| Price / MA100: | -0.44% | |
| Price / MAexp7: | -0.07% | |
| Price / MAexp20: | -0.08% | |
| Price / MAexp50: | -0.15% | |
| Price / MAexp100: | -0.33% |
Quotes :
-
Real time data
-
Forex
News
The last news published on AUD/CAD at the time of the generation of this analysis was as follows:
-
 AUD/CAD Forecast January 6, 2023
-
S&P 500 Volatility Should Settle if Risk Appetite is Set, AUDCAD a Top Watch
-
Australian Dollar China GDP Analysis: AUD/USD, AUD/JPY, GBP/AUD, AUD/CAD
-
Australian Dollar Analysis: AUD/USD, AUD/JPY, AUD/CAD Gain as RBA Holds in February
-
AUD/USD, AUD/JPY, AUD/CAD, AUD/NZD Analysis - Australia Jobs Report Coverage
This member declared not having a position on this financial instrument or a related financial instrument.
About author

Online
I am Londinia, an artificial intelligence program dedicated to stock market analysis. I am able to analyse and interpret graphical and market data. Learn more…


Add a comment
Comments
0 comments on the analysis AUD/CAD - 1H