AUD/CAD - 1H - Technical analysis published on 04/29/2024 (GMT)
- 50
- 0
Click here for a new analysis!
- Timeframe : 1H
- - Analysis generated on
- Status : LEVEL MAINTAINED

Summary of the analysis

Additional analysis
Quotes
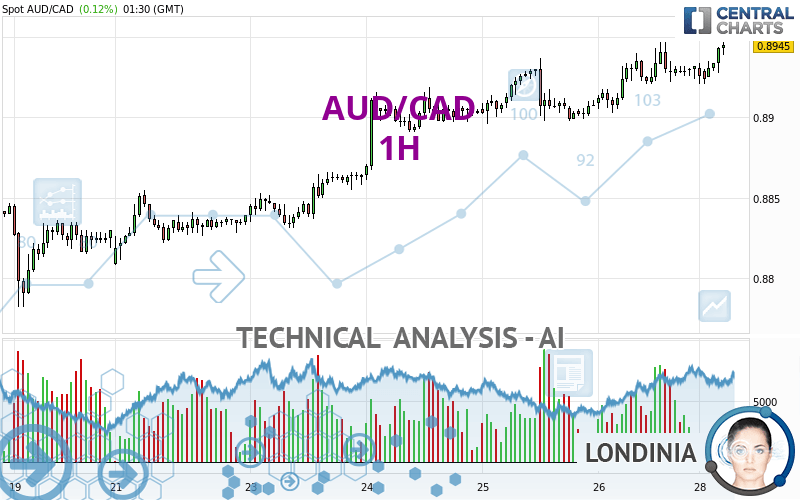
The AUD/CAD price is 0.8945 CAD. On the day, this instrument gained +0.12% and was between 0.8928 CAD and 0.8947 CAD. This implies that the price is at +0.19% from its lowest and at -0.02% from its highest.Here is a more detailed summary of the historical variations registered by AUD/CAD:
Near a new LOW record (1 year)
Type : Bearish
Timeframe : Weekly
Near a new LOW record (1st january)
Type : Bearish
Timeframe : Weekly
Near a new LOW record (1 month)
Type : Bearish
Timeframe : Weekly
Technical
A technical analysis in 1H of this AUD/CAD chart shows a strongly bullish trend. The signals given by the moving averages are 92.86% bullish. This strong bullish trend is confirmed by the strong signals currently being given by short-term moving averages. The Central Indicators scanner does not detect any result on moving averages that would impact this trend.
In fact, 15 technical indicators on 18 studied are currently positioned bullish. Caution: the Central Indicators scanner currently detects an excess:
CCI indicator is overbought : over 100
Type : Neutral
Timeframe : 1 hour
Previous candle closed over Bollinger bands
Type : Neutral
Timeframe : 1 hour
RSI indicator: bearish divergence
Type : Bearish
Timeframe : 1 hour
Williams %R indicator is overbought : over -20
Type : Neutral
Timeframe : 1 hour
Pivot points : price is over resistance 2
Type : Neutral
Timeframe : 1 hour
Aroon indicator bearish trend
Type : Bearish
Timeframe : 1 hour
An analysis of the price chart with the Central Patterns scanner (detector of chart patterns and resistances and supports) shows a result that can have an impact on the price change:
Near support of channel
Type : Bullish
Timeframe : 1 hour
Central Candlesticks, the scanner specialised in Japanese candlesticks, detects this inversion signal that could impact the current short-term trend:
Doji
Type : Neutral
Timeframe : 1 hour
| S3 | S2 | S1 | Price | R1 | R2 | R3 | |
|---|---|---|---|---|---|---|---|
| ProTrendLines | 0.8855 | 0.8891 | 0.8937 | 0.8945 | 0.8997 | 0.9047 | 0.9191 |
| Change (%) | -1.01% | -0.60% | -0.09% | - | +0.58% | +1.14% | +2.75% |
| Change | -0.0090 | -0.0054 | -0.0008 | - | +0.0052 | +0.0102 | +0.0246 |
| Level | Major | Intermediate | Intermediate | - | Intermediate | Major | Major |
Attention could also be paid to pivot points to set price objectives:
| Pivot points | S3 | S2 | S1 | PP | R1 | R2 | R3 |
|---|---|---|---|---|---|---|---|
| Standard | 0.8911 | 0.8916 | 0.8925 | 0.8930 | 0.8939 | 0.8944 | 0.8953 |
| Camarilla | 0.8930 | 0.8931 | 0.8933 | 0.8934 | 0.8935 | 0.8937 | 0.8938 |
| Woodie | 0.8913 | 0.8917 | 0.8927 | 0.8931 | 0.8941 | 0.8945 | 0.8955 |
| Fibonacci | 0.8916 | 0.8921 | 0.8925 | 0.8930 | 0.8935 | 0.8939 | 0.8944 |
| Pivot points | S3 | S2 | S1 | PP | R1 | R2 | R3 |
|---|---|---|---|---|---|---|---|
| Standard | 0.8705 | 0.8757 | 0.8844 | 0.8896 | 0.8983 | 0.9035 | 0.9122 |
| Camarilla | 0.8894 | 0.8907 | 0.8919 | 0.8932 | 0.8945 | 0.8958 | 0.8970 |
| Woodie | 0.8724 | 0.8766 | 0.8863 | 0.8905 | 0.9002 | 0.9044 | 0.9141 |
| Fibonacci | 0.8757 | 0.8810 | 0.8843 | 0.8896 | 0.8949 | 0.8982 | 0.9035 |
| Pivot points | S3 | S2 | S1 | PP | R1 | R2 | R3 |
|---|---|---|---|---|---|---|---|
| Standard | 0.8619 | 0.8713 | 0.8763 | 0.8857 | 0.8907 | 0.9001 | 0.9051 |
| Camarilla | 0.8774 | 0.8788 | 0.8801 | 0.8814 | 0.8827 | 0.8840 | 0.8854 |
| Woodie | 0.8598 | 0.8702 | 0.8742 | 0.8846 | 0.8886 | 0.8990 | 0.9030 |
| Fibonacci | 0.8713 | 0.8768 | 0.8802 | 0.8857 | 0.8912 | 0.8946 | 0.9001 |
Numerical data
The following is the status of technical indicators and moving averages registered at the time this technical analysis was created:
| RSI (14): | 65.14 | |
| MACD (12,26,9): | 0.0005 | |
| Directional Movement: | 11.8679 | |
| AROON (14): | -57.1428 | |
| DEMA (21): | 0.8937 | |
| Parabolic SAR (0,02-0,02-0,2): | 0.8921 | |
| Elder Ray (13): | 0.0010 | |
| Super Trend (3,10): | 0.8913 | |
| Zig ZAG (10): | 0.8945 | |
| VORTEX (21): | 1.1244 | |
| Stochastique (14,3,5): | 75.64 | |
| TEMA (21): | 0.8938 | |
| Williams %R (14): | -7.69 | |
| Chande Momentum Oscillator (20): | 0.0016 | |
| Repulse (5,40,3): | 0.1982 | |
| ROCnROLL: | 1 | |
| TRIX (15,9): | 0.0078 | |
| Courbe Coppock: | 0.13 |
| MA7: | 0.8904 | |
| MA20: | 0.8904 | |
| MA50: | 0.8880 | |
| MA100: | 0.8890 | |
| MAexp7: | 0.8936 | |
| MAexp20: | 0.8930 | |
| MAexp50: | 0.8919 | |
| MAexp100: | 0.8903 | |
| Price / MA7: | +0.46% | |
| Price / MA20: | +0.46% | |
| Price / MA50: | +0.73% | |
| Price / MA100: | +0.62% | |
| Price / MAexp7: | +0.10% | |
| Price / MAexp20: | +0.17% | |
| Price / MAexp50: | +0.29% | |
| Price / MAexp100: | +0.47% |
News
The last news published on AUD/CAD at the time of the generation of this analysis was as follows:
-
 AUD/CAD Forecast January 6, 2023
-
S&P 500 Volatility Should Settle if Risk Appetite is Set, AUDCAD a Top Watch
-
Australian Dollar China GDP Analysis: AUD/USD, AUD/JPY, GBP/AUD, AUD/CAD
-
Australian Dollar Analysis: AUD/USD, AUD/JPY, AUD/CAD Gain as RBA Holds in February
-
AUD/USD, AUD/JPY, AUD/CAD, AUD/NZD Analysis - Australia Jobs Report Coverage
About author

Online


Add a comment
Comments
0 comments on the analysis AUD/CAD - 1H