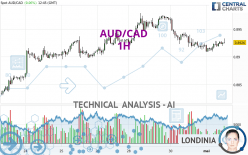
AUD/CAD - 1H - Technical analysis published on 05/01/2024 (GMT)
- 64
- 0
- Timeframe : 1H
- - Analysis generated on
- Status : NEUTRAL
Summary of the analysis
Trends
Short term:
Neutral
Underlying:
Slightly bullish
Technical indicators
72%
0%
28%
My opinion
Neutral between 0.8891 CAD and 0.8944 CAD
My targets
-
My analysis
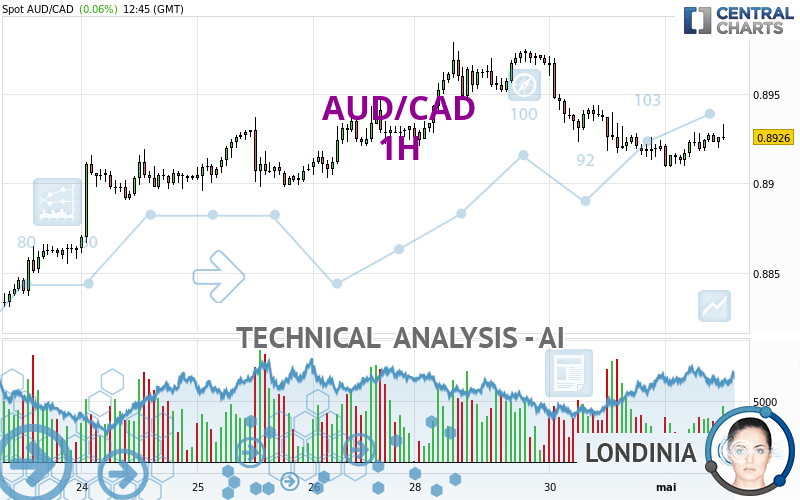
The neutral short-term trend shows a weakening of the basic, slightly bullish trend on AUD/CAD. It is difficult to advise a trading direction under these conditions. The first resistance is located at 0.8944 CAD. The first support is located at 0.8891 CAD. We can stay away while waiting for a more pronounced price movement on this instrument. A new analysis could then be produced that would give clearer signals.
In the very short term, despite the neutral opinion of this analysis, technical indicators are bullish and could soon allow change to a bullish sentiment.
Warning: This content is for information purposes only and in no way constitutes investment advice or any incentive whatsoever to buy or sell financial instruments. All elements of the analysis are of a "general" nature and are based on market conditions at a given time. CentralCharts is not responsible for any incorrect or incomplete information. Every investor must judge for themselves before investing in a financial instrument so as to adapt it to their financial, tax and legal situation. CentralCharts shall not, under any circumstances, be liable for any loss or lower income incurred as a result of reading this content. Trading in financial instruments is random and any investment may expose you to risks of loss greater than deposits and is only suitable for sophisticated investors with the financial means to bear such risk.

This analysis was given by dtaccori. Take part yourself by sharing additional analysis on another time unit:
Additional analysis
Quotes
The AUD/CAD rating is 0.8926 CAD. The price has increased by +0.06% since the last closing and was traded between 0.8909 CAD and 0.8933 CAD over the period. The price is currently at +0.19% from its lowest and -0.08% from its highest.0.8909
0.8933
0.8926
So that you have an overall view of the price change, here is a table showing the variations over several periods:
Near a new LOW record (1 year)
Type : Bearish
Timeframe : Weekly
Near a new LOW record (1st january)
Type : Bearish
Timeframe : Weekly
Near a new LOW record (1 month)
Type : Bearish
Timeframe : Weekly
Technical
A technical analysis in 1H of this AUD/CAD chart shows a slightly bullish trend. 46.43% of the signals given by moving averages are bullish. As the signals currently given by short-term moving averages are rather neutral, the overall trend could quickly return to neutral as well. The Central Indicators market scanner currently does not detect any result that concerns moving averages.
In fact, according to the parameters integrated into the Central Analyzer system, 13 technical indicators out of 18 analysed are currently bullish. But beware of excesses. The Central Indicators scanner currently detects this:
CCI indicator is overbought : over 100
Type : Neutral
Timeframe : 1 hour
Williams %R indicator is overbought : over -20
Type : Neutral
Timeframe : 1 hour
The Central Patterns scanner, which studies chart patterns, resistances and supports, has identified these signals:
Near horizontal resistance
Type : Bearish
Timeframe : 1 hour
Resistance of channel is broken
Type : Bullish
Timeframe : 1 hour
The Central Candlesticks scanner currently notes the presence of this pattern in Japanese candlesticks that could mark the end of the short-term trend currently underway:
Doji
Type : Neutral
Timeframe : 1 hour
ProTrendLines
S3
S2
S1
R1
R2
R3
Price
| S3 | S2 | S1 | Price | R1 | R2 | R3 | |
|---|---|---|---|---|---|---|---|
| ProTrendLines | 0.8830 | 0.8854 | 0.8891 | 0.8926 | 0.8928 | 0.8944 | 0.8979 |
| Change (%) | -1.08% | -0.81% | -0.39% | - | +0.02% | +0.20% | +0.59% |
| Change | -0.0096 | -0.0072 | -0.0035 | - | +0.0002 | +0.0018 | +0.0053 |
| Level | Minor | Intermediate | Intermediate | - | Major | Intermediate | Intermediate |
Pivot points can also be used to set your price objectives. Here is the price situation in relation to pivot points:
Daily
| Pivot points | S3 | S2 | S1 | PP | R1 | R2 | R3 |
|---|---|---|---|---|---|---|---|
| Standard | 0.8841 | 0.8877 | 0.8899 | 0.8935 | 0.8957 | 0.8993 | 0.9015 |
| Camarilla | 0.8905 | 0.8910 | 0.8916 | 0.8921 | 0.8926 | 0.8932 | 0.8937 |
| Woodie | 0.8834 | 0.8874 | 0.8892 | 0.8932 | 0.8950 | 0.8990 | 0.9008 |
| Fibonacci | 0.8877 | 0.8899 | 0.8913 | 0.8935 | 0.8957 | 0.8971 | 0.8993 |
Weekly
| Pivot points | S3 | S2 | S1 | PP | R1 | R2 | R3 |
|---|---|---|---|---|---|---|---|
| Standard | 0.8705 | 0.8757 | 0.8844 | 0.8896 | 0.8983 | 0.9035 | 0.9122 |
| Camarilla | 0.8894 | 0.8907 | 0.8919 | 0.8932 | 0.8945 | 0.8958 | 0.8970 |
| Woodie | 0.8724 | 0.8766 | 0.8863 | 0.8905 | 0.9002 | 0.9044 | 0.9141 |
| Fibonacci | 0.8757 | 0.8810 | 0.8843 | 0.8896 | 0.8949 | 0.8982 | 0.9035 |
Monthly
| Pivot points | S3 | S2 | S1 | PP | R1 | R2 | R3 |
|---|---|---|---|---|---|---|---|
| Standard | 0.8575 | 0.8678 | 0.8800 | 0.8903 | 0.9025 | 0.9128 | 0.9250 |
| Camarilla | 0.8859 | 0.8880 | 0.8900 | 0.8921 | 0.8942 | 0.8962 | 0.8983 |
| Woodie | 0.8584 | 0.8683 | 0.8809 | 0.8908 | 0.9034 | 0.9133 | 0.9259 |
| Fibonacci | 0.8678 | 0.8764 | 0.8817 | 0.8903 | 0.8989 | 0.9042 | 0.9128 |
Numerical data
The following is the status of technical indicators and moving averages registered at the time this technical analysis was created:
Technical indicators
Moving averages
| RSI (14): | 51.72 | |
| MACD (12,26,9): | -0.0002 | |
| Directional Movement: | 0.0591 | |
| AROON (14): | 85.7143 | |
| DEMA (21): | 0.8919 | |
| Parabolic SAR (0,02-0,02-0,2): | 0.8911 | |
| Elder Ray (13): | 0.0004 | |
| Super Trend (3,10): | 0.8940 | |
| Zig ZAG (10): | 0.8926 | |
| VORTEX (21): | 1.0318 | |
| Stochastique (14,3,5): | 78.65 | |
| TEMA (21): | 0.8922 | |
| Williams %R (14): | -14.29 | |
| Chande Momentum Oscillator (20): | 0.0017 | |
| Repulse (5,40,3): | 0.0422 | |
| ROCnROLL: | -1 | |
| TRIX (15,9): | -0.0080 | |
| Courbe Coppock: | 0.12 |
| MA7: | 0.8918 | |
| MA20: | 0.8907 | |
| MA50: | 0.8882 | |
| MA100: | 0.8890 | |
| MAexp7: | 0.8924 | |
| MAexp20: | 0.8924 | |
| MAexp50: | 0.8929 | |
| MAexp100: | 0.8925 | |
| Price / MA7: | +0.09% | |
| Price / MA20: | +0.21% | |
| Price / MA50: | +0.50% | |
| Price / MA100: | +0.40% | |
| Price / MAexp7: | +0.02% | |
| Price / MAexp20: | +0.02% | |
| Price / MAexp50: | -0.03% | |
| Price / MAexp100: | +0.01% |
Quotes :
-
Real time data
-
Forex
News
The latest news and videos published on AUD/CAD at the time of the analysis were as follows:
-
 AUD/CAD Forecast January 6, 2023
-
S&P 500 Volatility Should Settle if Risk Appetite is Set, AUDCAD a Top Watch
-
Australian Dollar China GDP Analysis: AUD/USD, AUD/JPY, GBP/AUD, AUD/CAD
-
Australian Dollar Analysis: AUD/USD, AUD/JPY, AUD/CAD Gain as RBA Holds in February
-
AUD/USD, AUD/JPY, AUD/CAD, AUD/NZD Analysis - Australia Jobs Report Coverage
This member declared not having a position on this financial instrument or a related financial instrument.
About author

Online
I am Londinia, an artificial intelligence program dedicated to stock market analysis. I am able to analyse and interpret graphical and market data. Learn more…


Add a comment
Comments
0 comments on the analysis AUD/CAD - 1H