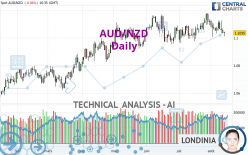
AUD/NZD - Daily - Technical analysis published on 08/12/2022 (GMT)
- 184
- 0
- Timeframe : Daily
- - Analysis generated on
- Status : NEUTRAL

Summary of the analysis

Additional analysis
Quotes
AUD/NZD rating 1.1036 NZD. On the day, this instrument lost -0.03% with the lowest point at 1.1011 NZD and the highest point at 1.1045 NZD. The deviation from the price is +0.23% for the low point and -0.08% for the high point.The Central Gaps scanner detects a bullish opening. A small advantage for buyers in the very short term.
Bullish opening
Type : Bullish
Timeframe : Openning
Here is a more detailed summary of the historical variations registered by AUD/NZD:
Near a new HIGH record (5 years)
Type : Bullish
Timeframe : Weekly
Near a new HIGH record (1 year)
Type : Bullish
Timeframe : Weekly
Near a new LOW record (1st january)
Type : Bearish
Timeframe : Weekly
Near a new HIGH record (1 month)
Type : Bullish
Timeframe : Weekly
Technical
Technical analysis of AUD/NZD in Daily shows an overall slightly bullish trend. Only 53.57% of the signals given by moving averages are bullish. This slightly bullish trend could turn neutral or reverse given the slightly bearish signals currently being given by short-term moving averages. The Central Indicators scanner detects a bearish signal on moving averages that could impact this trend:
Bearish trend reversal : adaptative moving average 50
Type : Bearish
Timeframe : Daily
In fact, Central Analyzer took into account 18 technical indicators and the result was as follows: 4 are bullish, 5 are neutral and 9 are bearish. But beware of excesses. The Central Indicators scanner currently detects this:
CCI indicator is oversold : under -100
Type : Neutral
Timeframe : Daily
Williams %R indicator is oversold : under -80
Type : Neutral
Timeframe : Daily
MACD indicator is back under 0
Type : Bearish
Timeframe : Daily
Price is back under the pivot point
Type : Bearish
Timeframe : Weekly
The Central Patterns scanner, which studies chart patterns, resistances and supports, has identified this signal:
Near support of channel
Type : Bullish
Timeframe : Daily
No result was found by the Central Candlesticks scanner on Japanese candlesticks.
| S3 | S2 | S1 | Price | R1 | R2 | R3 | |
|---|---|---|---|---|---|---|---|
| ProTrendLines | 1.0592 | 1.0827 | 1.0975 | 1.1036 | 1.1071 | 1.1155 | 1.1274 |
| Change (%) | -4.02% | -1.89% | -0.55% | - | +0.32% | +1.08% | +2.16% |
| Change | -0.0444 | -0.0209 | -0.0061 | - | +0.0035 | +0.0119 | +0.0238 |
| Level | Intermediate | Major | Intermediate | - | Intermediate | Major | Minor |
Attention could also be paid to pivot points to set price objectives:
| Pivot points | S3 | S2 | S1 | PP | R1 | R2 | R3 |
|---|---|---|---|---|---|---|---|
| Standard | 1.0993 | 1.1014 | 1.1026 | 1.1047 | 1.1059 | 1.1080 | 1.1092 |
| Camarilla | 1.1030 | 1.1033 | 1.1036 | 1.1039 | 1.1042 | 1.1045 | 1.1048 |
| Woodie | 1.0990 | 1.1012 | 1.1023 | 1.1045 | 1.1056 | 1.1078 | 1.1089 |
| Fibonacci | 1.1014 | 1.1026 | 1.1034 | 1.1047 | 1.1059 | 1.1067 | 1.1080 |
| Pivot points | S3 | S2 | S1 | PP | R1 | R2 | R3 |
|---|---|---|---|---|---|---|---|
| Standard | 1.0887 | 1.0947 | 1.1010 | 1.1070 | 1.1133 | 1.1193 | 1.1256 |
| Camarilla | 1.1039 | 1.1051 | 1.1062 | 1.1073 | 1.1084 | 1.1096 | 1.1107 |
| Woodie | 1.0889 | 1.0948 | 1.1012 | 1.1071 | 1.1135 | 1.1194 | 1.1258 |
| Fibonacci | 1.0947 | 1.0994 | 1.1023 | 1.1070 | 1.1117 | 1.1146 | 1.1193 |
| Pivot points | S3 | S2 | S1 | PP | R1 | R2 | R3 |
|---|---|---|---|---|---|---|---|
| Standard | 1.0773 | 1.0868 | 1.0991 | 1.1086 | 1.1209 | 1.1304 | 1.1427 |
| Camarilla | 1.1055 | 1.1075 | 1.1095 | 1.1115 | 1.1135 | 1.1155 | 1.1175 |
| Woodie | 1.0788 | 1.0875 | 1.1006 | 1.1093 | 1.1224 | 1.1311 | 1.1442 |
| Fibonacci | 1.0868 | 1.0951 | 1.1002 | 1.1086 | 1.1169 | 1.1220 | 1.1304 |
Numerical data
The following is the status of the technical indicators and moving averages at the time of publication of this technical analysis:
| RSI (14): | 44.26 | |
| MACD (12,26,9): | -0.0001 | |
| Directional Movement: | -5.4558 | |
| AROON (14): | -21.4285 | |
| DEMA (21): | 1.1073 | |
| Parabolic SAR (0,02-0,02-0,2): | 1.1154 | |
| Elder Ray (13): | -0.0040 | |
| Super Trend (3,10): | 1.0959 | |
| Zig ZAG (10): | 1.1035 | |
| VORTEX (21): | 1.0066 | |
| Stochastique (14,3,5): | 21.39 | |
| TEMA (21): | 1.1062 | |
| Williams %R (14): | -83.82 | |
| Chande Momentum Oscillator (20): | -0.0136 | |
| Repulse (5,40,3): | -0.3006 | |
| ROCnROLL: | 2 | |
| TRIX (15,9): | 0.0114 | |
| Courbe Coppock: | 0.55 |
| MA7: | 1.1062 | |
| MA20: | 1.1084 | |
| MA50: | 1.1062 | |
| MA100: | 1.1009 | |
| MAexp7: | 1.1059 | |
| MAexp20: | 1.1069 | |
| MAexp50: | 1.1050 | |
| MAexp100: | 1.0984 | |
| Price / MA7: | -0.24% | |
| Price / MA20: | -0.43% | |
| Price / MA50: | -0.24% | |
| Price / MA100: | +0.25% | |
| Price / MAexp7: | -0.21% | |
| Price / MAexp20: | -0.30% | |
| Price / MAexp50: | -0.13% | |
| Price / MAexp100: | +0.47% |
News
The latest news and videos published on AUD/NZD at the time of the analysis were as follows:
-
 Australian Dollar Analysis: AUD/USD and AUD/NZD May Bounce Before Selloff Resumes
-
EURUSD, USDJPY and AUDNZD Absorb ECB, Risk Trends, Key Data
-
Technical Analysis for EUR/USD, USD/CAD, AUD/NZD & More
-
Charts for Next Week – EUR/USD, USD/JPY, AUD/NZD & More
-
Trading Outlook – USD, Euro, Pound, AUD/NZD and More
About author
Online


Add a comment
Comments
0 comments on the analysis AUD/NZD - Daily