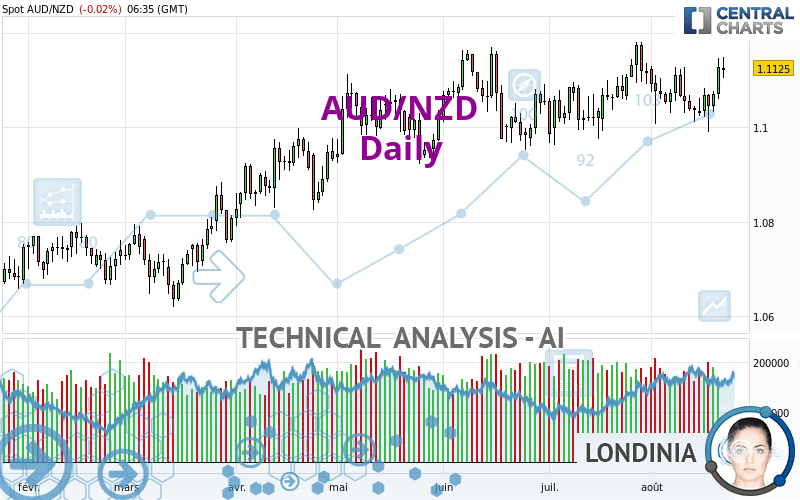
AUD/NZD - Daily - Technical analysis published on 08/22/2022 (GMT)
- 194
- 0
Click here for a new analysis!
- Timeframe : Daily
- - Analysis generated on
- Status : LEVEL MAINTAINED

Summary of the analysis

Additional analysis
Quotes
AUD/NZD rating 1.1125 NZD. On the day, this instrument lost -0.02% and was traded between 1.1103 NZD and 1.1149 NZD over the period. The price is currently at +0.20% from its lowest and -0.22% from its highest.A bearish opening was detected by the Central Gaps scanner. Sellers are trying to impose a bearish trend in the very short term.
Bearish opening
Type : Bearish
Timeframe : Openning
So that you have an overall view of the price change, here is a table showing the variations over several periods:
Near a new HIGH record (5 years)
Type : Bullish
Timeframe : Weekly
Near a new HIGH record (1 year)
Type : Bullish
Timeframe : Weekly
Near a new LOW record (1st january)
Type : Bearish
Timeframe : Weekly
Near a new LOW record (1 month)
Type : Bearish
Timeframe : Weekly
Technical
A technical analysis in Daily of this AUD/NZD chart shows a strongly bullish trend. 92.86% of the signals given by moving averages are bullish. This strongly bullish trend is supported by the strong bullish signals given by short-term moving averages. An assessment of moving averages reveals several bullish signals that could impact this trend:
Bullish trend reversal : Moving Average 20
Type : Bullish
Timeframe : Daily
Bullish trend reversal : Moving Average 50
Type : Bullish
Timeframe : Daily
The probability of a further increase is high given the direction of the technical indicators.
Caution: the Central Indicators scanner currently detects an excess:
RSI indicator: bearish divergence
Type : Bearish
Timeframe : Daily
Williams %R indicator is overbought : over -20
Type : Neutral
Timeframe : Daily
Central Patterns, the market scanner focusing on chart patterns, resistances and supports found these results:
Near horizontal resistance
Type : Bearish
Timeframe : Daily
Resistance of channel is broken
Type : Bullish
Timeframe : Daily
The Central Candlesticks scanner, specialised in Japanese candlesticks, did not identify any signals.
| S3 | S2 | S1 | Price | R1 | R2 | R3 | |
|---|---|---|---|---|---|---|---|
| ProTrendLines | 1.0827 | 1.0975 | 1.1073 | 1.1125 | 1.1155 | 1.1274 | 1.2364 |
| Change (%) | -2.68% | -1.35% | -0.47% | - | +0.27% | +1.34% | +11.14% |
| Change | -0.0298 | -0.0150 | -0.0052 | - | +0.0030 | +0.0149 | +0.1239 |
| Level | Major | Intermediate | Major | - | Major | Minor | Minor |
Attention could also be paid to pivot points to set price objectives:
| Pivot points | S3 | S2 | S1 | PP | R1 | R2 | R3 |
|---|---|---|---|---|---|---|---|
| Standard | 1.0987 | 1.1023 | 1.1075 | 1.1111 | 1.1163 | 1.1199 | 1.1251 |
| Camarilla | 1.1103 | 1.1111 | 1.1119 | 1.1127 | 1.1135 | 1.1143 | 1.1151 |
| Woodie | 1.0995 | 1.1027 | 1.1083 | 1.1115 | 1.1171 | 1.1203 | 1.1259 |
| Fibonacci | 1.1023 | 1.1057 | 1.1077 | 1.1111 | 1.1145 | 1.1165 | 1.1199 |
| Pivot points | S3 | S2 | S1 | PP | R1 | R2 | R3 |
|---|---|---|---|---|---|---|---|
| Standard | 1.0870 | 1.0930 | 1.1028 | 1.1088 | 1.1186 | 1.1246 | 1.1344 |
| Camarilla | 1.1084 | 1.1098 | 1.1113 | 1.1127 | 1.1142 | 1.1156 | 1.1171 |
| Woodie | 1.0890 | 1.0940 | 1.1048 | 1.1098 | 1.1206 | 1.1256 | 1.1364 |
| Fibonacci | 1.0930 | 1.0990 | 1.1027 | 1.1088 | 1.1148 | 1.1185 | 1.1246 |
| Pivot points | S3 | S2 | S1 | PP | R1 | R2 | R3 |
|---|---|---|---|---|---|---|---|
| Standard | 1.0773 | 1.0868 | 1.0991 | 1.1086 | 1.1209 | 1.1304 | 1.1427 |
| Camarilla | 1.1055 | 1.1075 | 1.1095 | 1.1115 | 1.1135 | 1.1155 | 1.1175 |
| Woodie | 1.0788 | 1.0875 | 1.1006 | 1.1093 | 1.1224 | 1.1311 | 1.1442 |
| Fibonacci | 1.0868 | 1.0951 | 1.1002 | 1.1086 | 1.1169 | 1.1220 | 1.1304 |
Numerical data
The following is the status of the technical indicators and moving averages at the time of publication of this technical analysis:
| RSI (14): | 58.66 | |
| MACD (12,26,9): | 0.0007 | |
| Directional Movement: | 5.5594 | |
| AROON (14): | 21.4286 | |
| DEMA (21): | 1.1084 | |
| Parabolic SAR (0,02-0,02-0,2): | 1.0992 | |
| Elder Ray (13): | 0.0047 | |
| Super Trend (3,10): | 1.0959 | |
| Zig ZAG (10): | 1.1124 | |
| VORTEX (21): | 1.0347 | |
| Stochastique (14,3,5): | 76.62 | |
| TEMA (21): | 1.1083 | |
| Williams %R (14): | -15.00 | |
| Chande Momentum Oscillator (20): | 0.0072 | |
| Repulse (5,40,3): | 0.6477 | |
| ROCnROLL: | 1 | |
| TRIX (15,9): | 0.0034 | |
| Courbe Coppock: | 0.36 |
| MA7: | 1.1072 | |
| MA20: | 1.1084 | |
| MA50: | 1.1059 | |
| MA100: | 1.1024 | |
| MAexp7: | 1.1087 | |
| MAexp20: | 1.1076 | |
| MAexp50: | 1.1057 | |
| MAexp100: | 1.0995 | |
| Price / MA7: | +0.48% | |
| Price / MA20: | +0.37% | |
| Price / MA50: | +0.60% | |
| Price / MA100: | +0.92% | |
| Price / MAexp7: | +0.34% | |
| Price / MAexp20: | +0.44% | |
| Price / MAexp50: | +0.61% | |
| Price / MAexp100: | +1.18% |
News
Don't forget to follow the news on AUD/NZD. At the time of publication of this analysis, the latest news was as follows:
-
 Australian Dollar Analysis: AUD/USD and AUD/NZD May Bounce Before Selloff Resumes
-
EURUSD, USDJPY and AUDNZD Absorb ECB, Risk Trends, Key Data
-
Technical Analysis for EUR/USD, USD/CAD, AUD/NZD & More
-
Charts for Next Week – EUR/USD, USD/JPY, AUD/NZD & More
-
Trading Outlook – USD, Euro, Pound, AUD/NZD and More
About author
Online


Add a comment
Comments
0 comments on the analysis AUD/NZD - Daily