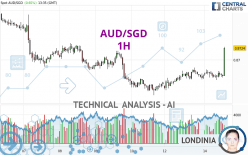
AUD/SGD - 1H - Technical analysis published on 11/14/2023 (GMT)
- 57
- 0
Click here for a new analysis!
- Timeframe : 1H
- - Analysis generated on
- Status : TARGET REACHED

Summary of the analysis

Additional analysis
Quotes
The AUD/SGD rating is 0.8724 SGD. The price has increased by +0.65% since the last closing with the lowest point at 0.8659 SGD and the highest point at 0.8726 SGD. The deviation from the price is +0.75% for the low point and -0.02% for the high point.A bullish opening was detected by the Central Gaps scanner. Buyers are trying to impose a bullish momentum in the very short term.
Bullish opening
Type : Bullish
Timeframe : Openning
A study of price movements over other periods shows the following variations:
Near a new LOW record (1 year)
Type : Bearish
Timeframe : Weekly
Near a new LOW record (1st january)
Type : Bearish
Timeframe : Weekly
Near a new HIGH record (1 month)
Type : Bullish
Timeframe : Weekly
Technical
Technical analysis of AUD/SGD in 1H shows an overall slightly bullish trend. 57.14% of the signals given by moving averages are bullish. This slightly bullish trend could be reinforced by the strong bullish signals given by short-term moving averages. The Central Indicators market scanner is currently detecting several bullish signals that could impact this trend:
Moving Average bullish crossovers : AMA20 & AMA50
Type : Bullish
Timeframe : 1 hour
Bullish price crossover with Moving Average 20
Type : Bullish
Timeframe : 1 hour
Bullish price crossover with Moving Average 100
Type : Bullish
Timeframe : 1 hour
An assessment of technical indicators does not currently provide any relevant information on the direction of future price movements.
Caution: the Central Indicators scanner currently detects an excess:
Williams %R indicator is overbought : over -20
Type : Neutral
Timeframe : 1 hour
Pivot points : price is over resistance 2
Type : Neutral
Timeframe : 1 hour
RSI indicator is back over 50
Type : Bullish
Timeframe : 1 hour
Parabolic SAR indicator bullish reversal
Type : Bullish
Timeframe : 1 hour
Ichimoku : price is over the cloud
Type : Bullish
Timeframe : 1 hour
Momentum indicator is back over 0
Type : Bullish
Timeframe : 1 hour
The Central Patterns scanner, which studies chart patterns, resistances and supports, has identified these signals:
Near horizontal resistance
Type : Bearish
Timeframe : 1 hour
Resistance of channel is broken
Type : Bullish
Timeframe : 1 hour
For a small rebound in the very short term, the Central Candlesticks scanner currently notes the presence of these bullish patterns in Japanese candlesticks:
White line without lower shadow
Type : Bullish
Timeframe : 1 hour
Long white line
Type : Bullish
Timeframe : 1 hour
| S3 | S2 | S1 | Price | R1 | R2 | R3 | |
|---|---|---|---|---|---|---|---|
| ProTrendLines | 0.8620 | 0.8661 | 0.8685 | 0.8724 | 0.8758 | 0.8792 | 0.8829 |
| Change (%) | -1.19% | -0.72% | -0.45% | - | +0.39% | +0.78% | +1.20% |
| Change | -0.0104 | -0.0063 | -0.0039 | - | +0.0034 | +0.0068 | +0.0105 |
| Level | Major | Minor | Major | - | Minor | Minor | Major |
To determine price objectives, it is also possible to use the pivot points. Here is the price position in relation to pivot points:
| Pivot points | S3 | S2 | S1 | PP | R1 | R2 | R3 |
|---|---|---|---|---|---|---|---|
| Standard | 0.8597 | 0.8617 | 0.8643 | 0.8663 | 0.8689 | 0.8709 | 0.8735 |
| Camarilla | 0.8655 | 0.8660 | 0.8664 | 0.8668 | 0.8672 | 0.8676 | 0.8681 |
| Woodie | 0.8599 | 0.8619 | 0.8645 | 0.8665 | 0.8691 | 0.8711 | 0.8737 |
| Fibonacci | 0.8617 | 0.8635 | 0.8646 | 0.8663 | 0.8681 | 0.8692 | 0.8709 |
| Pivot points | S3 | S2 | S1 | PP | R1 | R2 | R3 |
|---|---|---|---|---|---|---|---|
| Standard | 0.8388 | 0.8508 | 0.8581 | 0.8701 | 0.8774 | 0.8894 | 0.8967 |
| Camarilla | 0.8601 | 0.8619 | 0.8636 | 0.8654 | 0.8672 | 0.8689 | 0.8707 |
| Woodie | 0.8365 | 0.8496 | 0.8558 | 0.8689 | 0.8751 | 0.8882 | 0.8944 |
| Fibonacci | 0.8508 | 0.8582 | 0.8627 | 0.8701 | 0.8775 | 0.8820 | 0.8894 |
| Pivot points | S3 | S2 | S1 | PP | R1 | R2 | R3 |
|---|---|---|---|---|---|---|---|
| Standard | 0.8394 | 0.8502 | 0.8591 | 0.8699 | 0.8788 | 0.8896 | 0.8985 |
| Camarilla | 0.8625 | 0.8643 | 0.8661 | 0.8679 | 0.8697 | 0.8715 | 0.8733 |
| Woodie | 0.8384 | 0.8497 | 0.8581 | 0.8694 | 0.8778 | 0.8891 | 0.8975 |
| Fibonacci | 0.8502 | 0.8578 | 0.8624 | 0.8699 | 0.8775 | 0.8821 | 0.8896 |
Numerical data
The following is the status of technical indicators and moving averages registered at the time this technical analysis was created:
| RSI (14): | 58.25 | |
| MACD (12,26,9): | 0.0001 | |
| Directional Movement: | 5.4424 | |
| AROON (14): | -50.0000 | |
| DEMA (21): | 0.8671 | |
| Parabolic SAR (0,02-0,02-0,2): | 0.8659 | |
| Elder Ray (13): | 0.0003 | |
| Super Trend (3,10): | 0.8650 | |
| Zig ZAG (10): | 0.8674 | |
| VORTEX (21): | 0.9667 | |
| Stochastique (14,3,5): | 50.79 | |
| TEMA (21): | 0.8671 | |
| Williams %R (14): | -33.33 | |
| Chande Momentum Oscillator (20): | -0.0001 | |
| Repulse (5,40,3): | 0.0595 | |
| ROCnROLL: | 1 | |
| TRIX (15,9): | 0.0031 | |
| Courbe Coppock: | 0.01 |
| MA7: | 0.8688 | |
| MA20: | 0.8697 | |
| MA50: | 0.8721 | |
| MA100: | 0.8793 | |
| MAexp7: | 0.8670 | |
| MAexp20: | 0.8669 | |
| MAexp50: | 0.8668 | |
| MAexp100: | 0.8677 | |
| Price / MA7: | +0.41% | |
| Price / MA20: | +0.31% | |
| Price / MA50: | +0.03% | |
| Price / MA100: | -0.78% | |
| Price / MAexp7: | +0.62% | |
| Price / MAexp20: | +0.63% | |
| Price / MAexp50: | +0.65% | |
| Price / MAexp100: | +0.54% |
About author

Online


Add a comment
Comments
0 comments on the analysis AUD/SGD - 1H