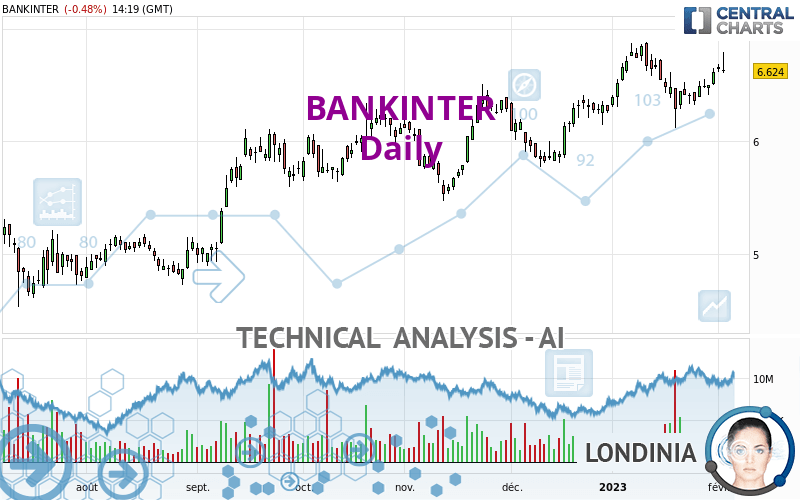
BANKINTER - Daily - Technical analysis published on 02/02/2023 (GMT)
- 147
- 0
Click here for a new analysis!
- Timeframe : Daily
- - Analysis generated on
- Status : TARGET REACHED

Summary of the analysis

Additional analysis
Quotes
BANKINTER rating 6.624 EUR. The price is lower by -0.48% since the last closing and was traded between 6.604 EUR and 6.790 EUR over the period. The price is currently at +0.30% from its lowest and -2.44% from its highest.The Central Gaps scanner detects a bearish opening marking the presence of sellers ahead of buyers at the opening but not sufficiently marked to allow the price to register a quotation gap.
Bearish opening
Type : Bearish
Timeframe : Openning
A study of price movements over other periods shows the following variations:
Near a new HIGH record (5 years)
Type : Bullish
Timeframe : Weekly
Near a new HIGH record (1 year)
Type : Bullish
Timeframe : Weekly
Near a new HIGH record (1st january)
Type : Bullish
Timeframe : Weekly
Near a new HIGH record (1 month)
Type : Bullish
Timeframe : Weekly
Technical
Technical analysis of this Daily chart of BANKINTER indicates that the overall trend is strongly bullish. 89.29% of the signals given by moving averages are bullish. The slightly bullish signals given by the short-term moving averages show a weakening of the global trend. The Central Indicators market scanner currently does not detect any result that concerns moving averages.
In fact, 14 technical indicators on 18 studied are currently positioned bullish. But beware of excesses. The Central Indicators scanner currently detects this:
Williams %R indicator is overbought : over -20
Type : Neutral
Timeframe : Daily
Pivot points : price is over resistance 2
Type : Neutral
Timeframe : Weekly
MACD crosses UP its Moving Average
Type : Bullish
Timeframe : Daily
Aroon indicator bullish trend
Type : Bullish
Timeframe : Daily
Ichimoku - Bullish crossover : Tenkan & Kijun
Type : Bullish
Timeframe : Daily
Price is back over the pivot point
Type : Bullish
Timeframe : Daily
The Central Patterns scanner, which studies chart patterns, resistances and supports, has identified this signal:
Near resistance of channel
Type : Bearish
Timeframe : Daily
The Central Candlesticks scanner which studies Japanese candlesticks did not detect anything.
| S3 | S2 | S1 | Price | R1 | |
|---|---|---|---|---|---|
| ProTrendLines | 4.986 | 5.561 | 6.285 | 6.624 | 6.844 |
| Change (%) | -24.73% | -16.05% | -5.12% | - | +3.32% |
| Change | -1.638 | -1.063 | -0.339 | - | +0.220 |
| Level | Minor | Major | Major | - | Major |
Pivot points can also be used to set your price objectives. Here is the price situation in relation to pivot points:
| Pivot points | S3 | S2 | S1 | PP | R1 | R2 | R3 |
|---|---|---|---|---|---|---|---|
| Standard | 6.556 | 6.588 | 6.622 | 6.654 | 6.688 | 6.720 | 6.754 |
| Camarilla | 6.638 | 6.644 | 6.650 | 6.656 | 6.662 | 6.668 | 6.674 |
| Woodie | 6.557 | 6.589 | 6.623 | 6.655 | 6.689 | 6.721 | 6.755 |
| Fibonacci | 6.588 | 6.613 | 6.629 | 6.654 | 6.679 | 6.695 | 6.720 |
| Pivot points | S3 | S2 | S1 | PP | R1 | R2 | R3 |
|---|---|---|---|---|---|---|---|
| Standard | 6.137 | 6.231 | 6.363 | 6.457 | 6.589 | 6.683 | 6.815 |
| Camarilla | 6.434 | 6.455 | 6.475 | 6.496 | 6.517 | 6.537 | 6.558 |
| Woodie | 6.157 | 6.241 | 6.383 | 6.467 | 6.609 | 6.693 | 6.835 |
| Fibonacci | 6.231 | 6.317 | 6.370 | 6.457 | 6.543 | 6.596 | 6.683 |
| Pivot points | S3 | S2 | S1 | PP | R1 | R2 | R3 |
|---|---|---|---|---|---|---|---|
| Standard | 5.441 | 5.781 | 6.201 | 6.541 | 6.961 | 7.301 | 7.721 |
| Camarilla | 6.411 | 6.481 | 6.550 | 6.620 | 6.690 | 6.759 | 6.829 |
| Woodie | 5.480 | 5.801 | 6.240 | 6.561 | 7.000 | 7.321 | 7.760 |
| Fibonacci | 5.781 | 6.072 | 6.251 | 6.541 | 6.832 | 7.011 | 7.301 |
Numerical data
The following is the status of the technical indicators and moving averages at the time of publication of this technical analysis:
| RSI (14): | 61.47 | |
| MACD (12,26,9): | 0.0680 | |
| Directional Movement: | 9.986 | |
| AROON (14): | 71.429 | |
| DEMA (21): | 6.606 | |
| Parabolic SAR (0,02-0,02-0,2): | 6.232 | |
| Elder Ray (13): | 0.158 | |
| Super Trend (3,10): | 6.850 | |
| Zig ZAG (10): | 6.660 | |
| VORTEX (21): | 0.9940 | |
| Stochastique (14,3,5): | 81.13 | |
| TEMA (21): | 6.577 | |
| Williams %R (14): | -19.46 | |
| Chande Momentum Oscillator (20): | 0.180 | |
| Repulse (5,40,3): | 0.8860 | |
| ROCnROLL: | 1 | |
| TRIX (15,9): | 0.1580 | |
| Courbe Coppock: | 2.95 |
| MA7: | 6.541 | |
| MA20: | 6.561 | |
| MA50: | 6.312 | |
| MA100: | 6.076 | |
| MAexp7: | 6.573 | |
| MAexp20: | 6.507 | |
| MAexp50: | 6.332 | |
| MAexp100: | 6.075 | |
| Price / MA7: | +1.27% | |
| Price / MA20: | +0.96% | |
| Price / MA50: | +4.94% | |
| Price / MA100: | +9.02% | |
| Price / MAexp7: | +0.78% | |
| Price / MAexp20: | +1.80% | |
| Price / MAexp50: | +4.61% | |
| Price / MAexp100: | +9.04% |
About author
Online


Add a comment
Comments
0 comments on the analysis BANKINTER - Daily