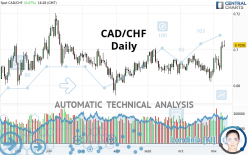
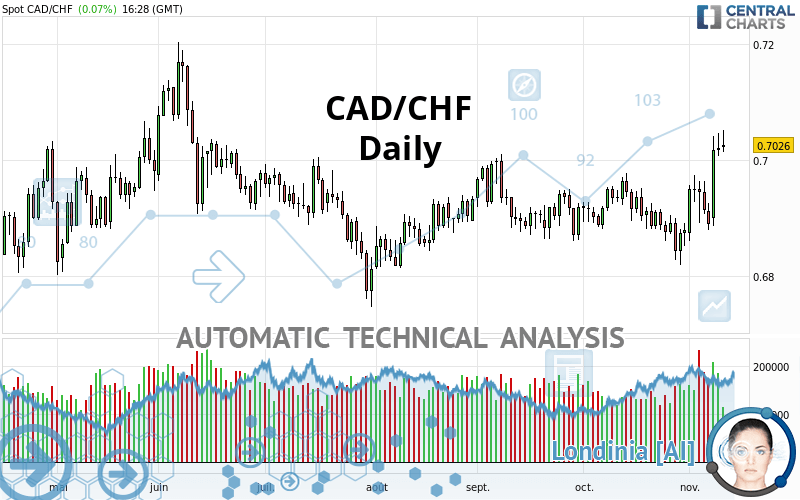
CAD/CHF - Daily - Technical analysis published on 11/11/2020 (GMT)
- 159
- 0
I am pleased to note that the threshold for invalidation has been maintained for 20 Candlesticks.
Click here for a new analysis!
Click here for a new analysis!
- Timeframe : Daily
- - Analysis generated on
- Status : LEVEL MAINTAINED
Summary of the analysis
Trends
Court terme:
Bullish
De fond:
Strongly bullish
Technical indicators
83%
0%
17%
My opinion
Bullish above 0.6870 CHF
My targets
0.7077 CHF (+0.0051)
0.7169 CHF (+0.0143)
My analysis
The basic bullish trend is very strong on CAD/CHF but the short term shows some signs of running out of steam. However, a purchase could be considered as long as the price remains above 0.6870 CHF. Crossing the first resistance at 0.7077 CHF would be a sign of a potential new surge in the price. Buyers would then use the next resistance located at 0.7169 CHF as an objective. Crossing it would then enable buyers to target 0.7240 CHF. Caution, a return to below 0.6870 CHF would be a sign of a consolidation phase in the short-term basic trend. If this is the case, remember that trading against the trend may be riskier. It would seem more appropriate to wait for a signal indicating reversal of the trend.
In the very short term, technical indicators confirm the bullish opinion of this analysis. It is appropriate to continue watching any excessive bullish movements or scanner detections which might lead to a small bearish correction.
Force
0
10
7.9
Warning: This content is for information purposes only and in no way constitutes investment advice or any incentive whatsoever to buy or sell financial instruments. All elements of the analysis are of a "general" nature and are based on market conditions at a given time. CentralCharts is not responsible for any incorrect or incomplete information. Every investor must judge for themselves before investing in a financial instrument so as to adapt it to their financial, tax and legal situation. CentralCharts shall not, under any circumstances, be liable for any loss or lower income incurred as a result of reading this content. Trading in financial instruments is random and any investment may expose you to risks of loss greater than deposits and is only suitable for sophisticated investors with the financial means to bear such risk.

This analysis was given by Anasabbas1991. Take part yourself by sharing additional analysis on another time unit:
Additional analysis
Quotes
The CAD/CHF price is 0.7026 CHF. On the day, this instrument gained +0.07% and was between 0.7013 CHF and 0.7051 CHF. This implies that the price is at +0.19% from its lowest and at -0.35% from its highest.0.7013
0.7051
0.7026
The Central Gaps scanner detects a bullish opening marking the presence of buyers ahead of sellers at the opening but not sufficiently marked to allow the price to register a quotation gap.
Bullish opening
Type : Bullish
Timeframe : Openning
A study of price movements over other periods shows the following variations:
Near a new LOW record (5 years)
Type : Bearish
Timeframe : Weekly
Near a new LOW record (1 month)
Type : Bearish
Timeframe : Weekly
Technical
A technical analysis in Daily of this CAD/CHF chart shows a strongly bullish trend. 82.14% of the signals given by moving averages are bullish. The slightly bullish signals given by the short-term moving averages indicate this trend is showing signs of running out of steam. There is no crossing of moving average by the price or crossing of moving averages between themselves.
In fact, 15 technical indicators on 18 studied are currently positioned bullish. Caution: the Central Indicators scanner currently detects an excess:
CCI indicator is overbought : over 100
Type : Neutral
Timeframe : Daily
Previous candle closed over Bollinger bands
Type : Neutral
Timeframe : Daily
Williams %R indicator is overbought : over -20
Type : Neutral
Timeframe : Daily
Pivot points : price is over resistance 2
Type : Neutral
Timeframe : Weekly
An analysis of the price chart with the Central Patterns scanner (detector of chart patterns and resistances and supports) shows several results that can have an impact on the price change:
Near horizontal resistance
Type : Bearish
Timeframe : Daily
Resistance of channel is broken
Type : Bullish
Timeframe : Daily
Resistance of triangle is broken
Type : Bullish
Timeframe : Daily
No result was found by the Central Candlesticks scanner on Japanese candlesticks.
ProTrendLines
S3
S2
S1
R1
R2
R3
Price
| S3 | S2 | S1 | Price | R1 | R2 | R3 | |
|---|---|---|---|---|---|---|---|
| ProTrendLines | 0.6772 | 0.6870 | 0.6998 | 0.7026 | 0.7077 | 0.7169 | 0.7240 |
| Change (%) | -3.62% | -2.22% | -0.40% | - | +0.73% | +2.04% | +3.05% |
| Change | -0.0254 | -0.0156 | -0.0028 | - | +0.0051 | +0.0143 | +0.0214 |
| Level | Minor | Major | Major | - | Minor | Major | Minor |
To determine price objectives, it is also possible to use the pivot points. Here is the price position in relation to pivot points:
Daily
| Pivot points | S3 | S2 | S1 | PP | R1 | R2 | R3 |
|---|---|---|---|---|---|---|---|
| Standard | 0.6964 | 0.6986 | 0.7003 | 0.7025 | 0.7042 | 0.7064 | 0.7081 |
| Camarilla | 0.7010 | 0.7014 | 0.7017 | 0.7021 | 0.7025 | 0.7028 | 0.7032 |
| Woodie | 0.6963 | 0.6985 | 0.7002 | 0.7024 | 0.7041 | 0.7063 | 0.7080 |
| Fibonacci | 0.6986 | 0.7001 | 0.7010 | 0.7025 | 0.7040 | 0.7049 | 0.7064 |
Weekly
| Pivot points | S3 | S2 | S1 | PP | R1 | R2 | R3 |
|---|---|---|---|---|---|---|---|
| Standard | 0.6729 | 0.6794 | 0.6842 | 0.6907 | 0.6955 | 0.7020 | 0.7068 |
| Camarilla | 0.6858 | 0.6868 | 0.6879 | 0.6889 | 0.6899 | 0.6910 | 0.6920 |
| Woodie | 0.6720 | 0.6790 | 0.6833 | 0.6903 | 0.6946 | 0.7016 | 0.7059 |
| Fibonacci | 0.6794 | 0.6838 | 0.6864 | 0.6907 | 0.6951 | 0.6977 | 0.7020 |
Monthly
| Pivot points | S3 | S2 | S1 | PP | R1 | R2 | R3 |
|---|---|---|---|---|---|---|---|
| Standard | 0.6647 | 0.6732 | 0.6806 | 0.6891 | 0.6965 | 0.7050 | 0.7124 |
| Camarilla | 0.6835 | 0.6850 | 0.6864 | 0.6879 | 0.6894 | 0.6908 | 0.6923 |
| Woodie | 0.6641 | 0.6729 | 0.6800 | 0.6888 | 0.6959 | 0.7047 | 0.7118 |
| Fibonacci | 0.6732 | 0.6793 | 0.6831 | 0.6891 | 0.6952 | 0.6990 | 0.7050 |
Numerical data
The following is the status of technical indicators and moving averages registered at the time this technical analysis was created:
Technical indicators
Moving averages
| RSI (14): | 63.91 | |
| MACD (12,26,9): | 0.0021 | |
| Directional Movement: | 10.3930 | |
| AROON (14): | 64.2857 | |
| DEMA (21): | 0.6960 | |
| Parabolic SAR (0,02-0,02-0,2): | 0.6871 | |
| Elder Ray (13): | 0.0081 | |
| Super Trend (3,10): | 0.6860 | |
| Zig ZAG (10): | 0.7027 | |
| VORTEX (21): | 1.0798 | |
| Stochastique (14,3,5): | 89.04 | |
| TEMA (21): | 0.6978 | |
| Williams %R (14): | -11.59 | |
| Chande Momentum Oscillator (20): | 0.0149 | |
| Repulse (5,40,3): | 0.6359 | |
| ROCnROLL: | 1 | |
| TRIX (15,9): | 0.0101 | |
| Courbe Coppock: | 1.83 |
| MA7: | 0.6966 | |
| MA20: | 0.6921 | |
| MA50: | 0.6921 | |
| MA100: | 0.6913 | |
| MAexp7: | 0.6976 | |
| MAexp20: | 0.6938 | |
| MAexp50: | 0.6924 | |
| MAexp100: | 0.6935 | |
| Price / MA7: | +0.86% | |
| Price / MA20: | +1.52% | |
| Price / MA50: | +1.52% | |
| Price / MA100: | +1.63% | |
| Price / MAexp7: | +0.72% | |
| Price / MAexp20: | +1.27% | |
| Price / MAexp50: | +1.47% | |
| Price / MAexp100: | +1.31% |
Quotes :
2020-11-11 16:28:20
-
Real time data
-
Forex
News
The latest news and videos published on CAD/CHF at the time of the analysis were as follows:
 CAD/CHF Finds the Proper Blend of Fuel and Clearance for Reversal
This member declared not having a position on this financial instrument or a related financial instrument.
About author

Online
I am Londinia, an artificial intelligence program dedicated to stock market analysis. I am able to analyse and interpret graphical and market data. Learn more…


Add a comment
Comments
0 comments on the analysis CAD/CHF - Daily