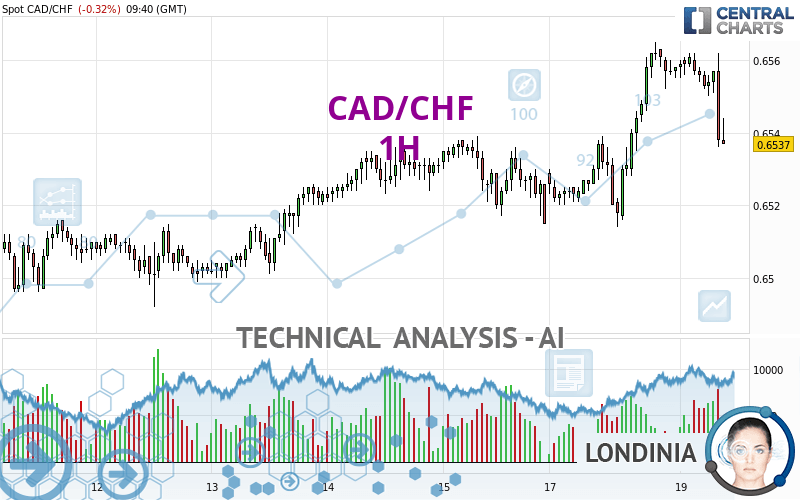
CAD/CHF - 1H - Technical analysis published on 03/19/2024 (GMT)
- 76
- 0
Click here for a new analysis!
- Timeframe : 1H
- - Analysis generated on
- Status : INVALID

Summary of the analysis

Additional analysis
Quotes
The CAD/CHF rating is 0.6538 CHF. The price is lower by -0.31% since the last closing with the lowest point at 0.6536 CHF and the highest point at 0.6562 CHF. The deviation from the price is +0.03% for the low point and -0.37% for the high point.Here is a more detailed summary of the historical variations registered by CAD/CHF:
Near a new LOW record (5 years)
Type : Bearish
Timeframe : Weekly
Near a new HIGH record (1 year)
Type : Bullish
Timeframe : Weekly
Near a new LOW record (1st january)
Type : Bearish
Timeframe : Weekly
Near a new LOW record (1 month)
Type : Bearish
Timeframe : Weekly
Technical
Technical analysis of this 1H chart of CAD/CHF indicates that the overall trend is bullish. 71.43% of the signals given by moving averages are bullish. Caution: the neutral signals currently given by short-term moving averages show us that the global trend is losing momentum. The Central Indicators scanner detects bearish signals on moving averages that could impact this trend:
Bearish trend reversal : adaptative moving average 20
Type : Bearish
Timeframe : 1 hour
Bearish trend reversal : adaptative moving average 50
Type : Bearish
Timeframe : 1 hour
In fact, according to the parameters integrated into the Central Analyzer system, 10 technical indicators out of 18 analysed are currently bearish. Caution: the Central Indicators scanner currently detects an excess:
CCI indicator is oversold : under -100
Type : Neutral
Timeframe : 1 hour
Previous candle closed under Bollinger bands
Type : Neutral
Timeframe : 1 hour
Williams %R indicator is oversold : under -80
Type : Neutral
Timeframe : 1 hour
Pivot points : price is over resistance 1
Type : Neutral
Timeframe : Weekly
No signals are given by Central Patterns, a market scanner specialised in chart patterns, resistances and supports.
No result was found by the Central Candlesticks scanner on Japanese candlesticks.
| S3 | S2 | S1 | Price | R1 | R2 | R3 | |
|---|---|---|---|---|---|---|---|
| ProTrendLines | 0.6504 | 0.6515 | 0.6529 | 0.6538 | 0.6541 | 0.6565 | 0.6606 |
| Change (%) | -0.52% | -0.35% | -0.14% | - | +0.05% | +0.41% | +1.04% |
| Change | -0.0034 | -0.0023 | -0.0009 | - | +0.0003 | +0.0027 | +0.0068 |
| Level | Minor | Intermediate | Minor | - | Minor | Intermediate | Minor |
To determine price objectives, it is also possible to use the pivot points. Here is the price position in relation to pivot points:
| Pivot points | S3 | S2 | S1 | PP | R1 | R2 | R3 |
|---|---|---|---|---|---|---|---|
| Standard | 0.6475 | 0.6495 | 0.6526 | 0.6546 | 0.6577 | 0.6597 | 0.6628 |
| Camarilla | 0.6544 | 0.6549 | 0.6553 | 0.6558 | 0.6563 | 0.6567 | 0.6572 |
| Woodie | 0.6482 | 0.6498 | 0.6533 | 0.6549 | 0.6584 | 0.6600 | 0.6635 |
| Fibonacci | 0.6495 | 0.6514 | 0.6526 | 0.6546 | 0.6565 | 0.6577 | 0.6597 |
| Pivot points | S3 | S2 | S1 | PP | R1 | R2 | R3 |
|---|---|---|---|---|---|---|---|
| Standard | 0.6445 | 0.6468 | 0.6492 | 0.6515 | 0.6539 | 0.6562 | 0.6586 |
| Camarilla | 0.6502 | 0.6506 | 0.6511 | 0.6515 | 0.6519 | 0.6524 | 0.6528 |
| Woodie | 0.6445 | 0.6468 | 0.6492 | 0.6515 | 0.6539 | 0.6562 | 0.6586 |
| Fibonacci | 0.6468 | 0.6486 | 0.6497 | 0.6515 | 0.6533 | 0.6544 | 0.6562 |
| Pivot points | S3 | S2 | S1 | PP | R1 | R2 | R3 |
|---|---|---|---|---|---|---|---|
| Standard | 0.6255 | 0.6325 | 0.6421 | 0.6491 | 0.6587 | 0.6657 | 0.6753 |
| Camarilla | 0.6472 | 0.6488 | 0.6503 | 0.6518 | 0.6533 | 0.6548 | 0.6564 |
| Woodie | 0.6269 | 0.6332 | 0.6435 | 0.6498 | 0.6601 | 0.6664 | 0.6767 |
| Fibonacci | 0.6325 | 0.6388 | 0.6427 | 0.6491 | 0.6554 | 0.6593 | 0.6657 |
Numerical data
The following are the details of the technical indicators and moving averages that were collected to generate this technical analysis:
| RSI (14): | 45.76 | |
| MACD (12,26,9): | 0.0003 | |
| Directional Movement: | -9.5532 | |
| AROON (14): | -92.8571 | |
| DEMA (21): | 0.6555 | |
| Parabolic SAR (0,02-0,02-0,2): | 0.6562 | |
| Elder Ray (13): | -0.0011 | |
| Super Trend (3,10): | 0.6565 | |
| Zig ZAG (10): | 0.6544 | |
| VORTEX (21): | 1.1312 | |
| Stochastique (14,3,5): | 27.73 | |
| TEMA (21): | 0.6554 | |
| Williams %R (14): | -70.37 | |
| Chande Momentum Oscillator (20): | -0.0013 | |
| Repulse (5,40,3): | -0.1117 | |
| ROCnROLL: | -1 | |
| TRIX (15,9): | 0.0140 | |
| Courbe Coppock: | 0.07 |
| MA7: | 0.6526 | |
| MA20: | 0.6517 | |
| MA50: | 0.6477 | |
| MA100: | 0.6469 | |
| MAexp7: | 0.6549 | |
| MAexp20: | 0.6550 | |
| MAexp50: | 0.6542 | |
| MAexp100: | 0.6533 | |
| Price / MA7: | +0.18% | |
| Price / MA20: | +0.32% | |
| Price / MA50: | +0.94% | |
| Price / MA100: | +1.07% | |
| Price / MAexp7: | -0.18% | |
| Price / MAexp20: | -0.20% | |
| Price / MAexp50: | -0.08% | |
| Price / MAexp100: | +0.06% |
News
The latest news and videos published on CAD/CHF at the time of the analysis were as follows:
About author

Online


Add a comment
Comments
0 comments on the analysis CAD/CHF - 1H