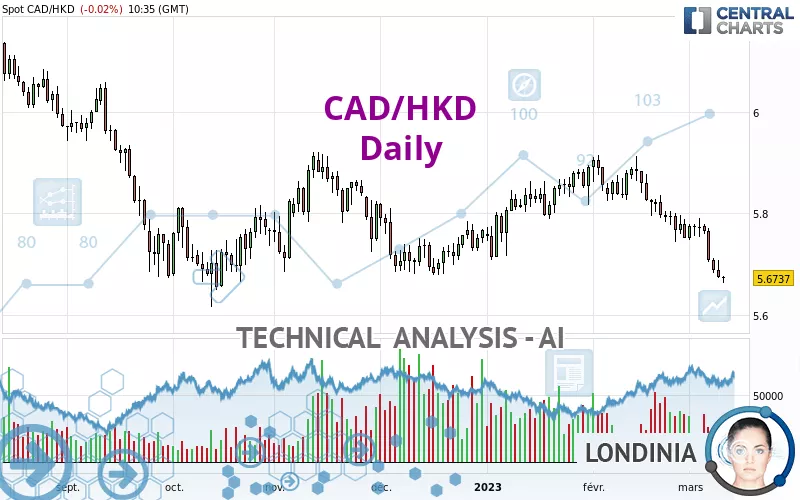
CAD/HKD - Daily - Technical analysis published on 03/10/2023 (GMT)
- 161
- 0
Click here for a new analysis!
- Timeframe : Daily
- - Analysis generated on
- Status : INVALID

Summary of the analysis

Additional analysis
Quotes
CAD/HKD rating 5.6737 HKD. The price is lower by -0.03% since the last closing with the lowest point at 5.6632 HKD and the highest point at 5.6775 HKD. The deviation from the price is +0.19% for the low point and -0.07% for the high point.A bullish opening was detected by the Central Gaps scanner. Buyers are trying to impose a bullish momentum in the very short term.
Bullish opening
Type : Bullish
Timeframe : Openning
Here is a more detailed summary of the historical variations registered by CAD/HKD:
Near a new LOW record (1 year)
Type : Bearish
Timeframe : Weekly
Near a new HIGH record (1st january)
Type : Bullish
Timeframe : Weekly
New LOW record (1st january)
Type : Bearish
Timeframe : Weekly
Near a new HIGH record (1 month)
Type : Bullish
Timeframe : Weekly
New LOW record (1 month)
Type : Bearish
Timeframe : Weekly
Technical
Technical analysis of this Daily chart of CAD/HKD indicates that the overall trend is strongly bearish. 89.29% of the signals given by moving averages are bearish. The overall trend is supported by the strong bearish signals from short-term moving averages. The Central Indicators scanner does not detect any result on moving averages that would impact this trend.
In fact, according to the parameters integrated into the Central Analyzer system, 12 technical indicators out of 18 analysed are currently bearish. Caution: the Central Indicators scanner currently detects an excess:
RSI indicator is oversold : under 30
Type : Neutral
Timeframe : Daily
CCI indicator is oversold : under -100
Type : Neutral
Timeframe : Daily
Williams %R indicator is oversold : under -80
Type : Neutral
Timeframe : Daily
Pivot points : price is under support 3
Type : Neutral
Timeframe : Weekly
An analysis of the price chart with the Central Patterns scanner (detector of chart patterns and resistances and supports) shows several results that can have an impact on the price change:
Near horizontal support
Type : Bullish
Timeframe : Daily
Near support of channel
Type : Bullish
Timeframe : Daily
Central Candlesticks, the scanner specialised in Japanese candlesticks, detects this inversion signal that could impact the current short-term trend:
Doji
Type : Neutral
Timeframe : Daily
| S2 | S1 | Price | R1 | R2 | R3 | |
|---|---|---|---|---|---|---|
| ProTrendLines | 5.3564 | 5.6580 | 5.6737 | 5.7927 | 5.9123 | 5.9696 |
| Change (%) | -5.59% | -0.28% | - | +2.10% | +4.21% | +5.22% |
| Change | -0.3173 | -0.0157 | - | +0.1190 | +0.2386 | +0.2959 |
| Level | Major | Major | - | Minor | Minor | Major |
Attention could also be paid to pivot points to set price objectives:
| Pivot points | S3 | S2 | S1 | PP | R1 | R2 | R3 |
|---|---|---|---|---|---|---|---|
| Standard | 5.6280 | 5.6505 | 5.6628 | 5.6853 | 5.6976 | 5.7201 | 5.7324 |
| Camarilla | 5.6655 | 5.6687 | 5.6719 | 5.6751 | 5.6783 | 5.6815 | 5.6847 |
| Woodie | 5.6229 | 5.6480 | 5.6577 | 5.6828 | 5.6925 | 5.7176 | 5.7273 |
| Fibonacci | 5.6505 | 5.6638 | 5.6720 | 5.6853 | 5.6986 | 5.7068 | 5.7201 |
| Pivot points | S3 | S2 | S1 | PP | R1 | R2 | R3 |
|---|---|---|---|---|---|---|---|
| Standard | 5.6973 | 5.7220 | 5.7472 | 5.7719 | 5.7971 | 5.8218 | 5.8470 |
| Camarilla | 5.7588 | 5.7634 | 5.7679 | 5.7725 | 5.7771 | 5.7817 | 5.7862 |
| Woodie | 5.6977 | 5.7221 | 5.7476 | 5.7720 | 5.7975 | 5.8219 | 5.8474 |
| Fibonacci | 5.7220 | 5.7410 | 5.7528 | 5.7719 | 5.7909 | 5.8027 | 5.8218 |
| Pivot points | S3 | S2 | S1 | PP | R1 | R2 | R3 |
|---|---|---|---|---|---|---|---|
| Standard | 5.5222 | 5.6331 | 5.6925 | 5.8034 | 5.8628 | 5.9737 | 6.0331 |
| Camarilla | 5.7051 | 5.7207 | 5.7363 | 5.7519 | 5.7675 | 5.7831 | 5.7987 |
| Woodie | 5.4965 | 5.6202 | 5.6668 | 5.7905 | 5.8371 | 5.9608 | 6.0074 |
| Fibonacci | 5.6331 | 5.6982 | 5.7384 | 5.8034 | 5.8685 | 5.9087 | 5.9737 |
Numerical data
The following is the status of technical indicators and moving averages registered at the time this technical analysis was created:
| RSI (14): | 26.86 | |
| MACD (12,26,9): | -0.0373 | |
| Directional Movement: | -23.8490 | |
| AROON (14): | -92.8571 | |
| DEMA (21): | 5.7210 | |
| Parabolic SAR (0,02-0,02-0,2): | 5.7541 | |
| Elder Ray (13): | -0.0708 | |
| Super Trend (3,10): | 5.7761 | |
| Zig ZAG (10): | 5.6750 | |
| VORTEX (21): | 0.7838 | |
| Stochastique (14,3,5): | 4.23 | |
| TEMA (21): | 5.6875 | |
| Williams %R (14): | -93.14 | |
| Chande Momentum Oscillator (20): | -0.1167 | |
| Repulse (5,40,3): | -0.8571 | |
| ROCnROLL: | 2 | |
| TRIX (15,9): | -0.0605 | |
| Courbe Coppock: | 3.94 |
| MA7: | 5.7225 | |
| MA20: | 5.7807 | |
| MA50: | 5.8134 | |
| MA100: | 5.7956 | |
| MAexp7: | 5.7121 | |
| MAexp20: | 5.7630 | |
| MAexp50: | 5.7926 | |
| MAexp100: | 5.8166 | |
| Price / MA7: | -0.85% | |
| Price / MA20: | -1.85% | |
| Price / MA50: | -2.40% | |
| Price / MA100: | -2.10% | |
| Price / MAexp7: | -0.67% | |
| Price / MAexp20: | -1.55% | |
| Price / MAexp50: | -2.05% | |
| Price / MAexp100: | -2.46% |
About author
Online


Add a comment
Comments
0 comments on the analysis CAD/HKD - Daily