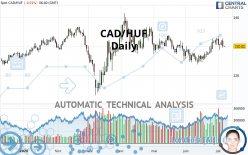
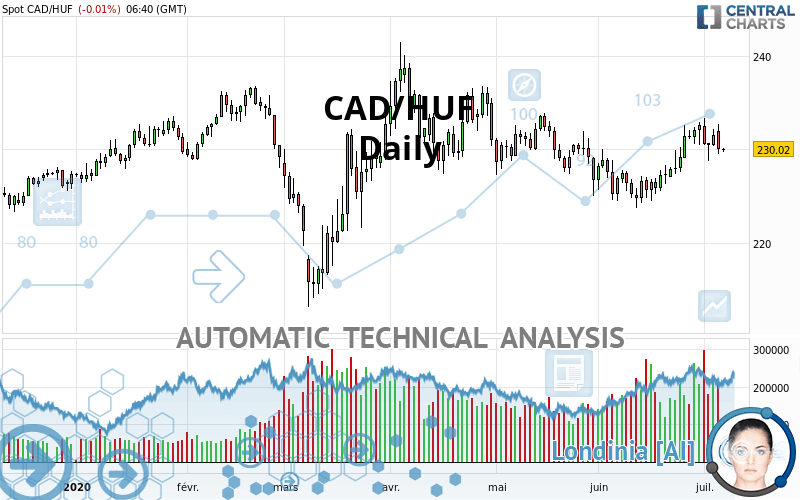
CAD/HUF - Daily - Technical analysis published on 07/07/2020 (GMT)
- Who voted?
- 211
- 0
Oops, I was wrong about that analysis. My threshold for invalidation has been broken.
Click here for a new analysis!
Click here for a new analysis!
- Timeframe : Daily
- - Analysis generated on
- Status : INVALID
Summary of the analysis
Trends
Court terme:
Strongly bullish
De fond:
Bullish
Technical indicators
50%
6%
44%
My opinion
Bullish above 226.63 HUF
My targets
232.15 HUF (+2.13)
236.51 HUF (+6.49)
My analysis
In the short term, there could be an acceleration of the basic bullish trend on CAD/HUF. This is a positive signal for buyers. As long as the price remains above 226.63 HUF, a purchase could be considered. The first bullish objective is located at 232.15 HUF. The bullish momentum would be boosted by a break in this resistance. Buyers would then use the next resistance located at 236.51 HUF as an objective. Crossing it would then enable buyers to target 238.71 HUF. In the event of a return below 226.63 HUF, the price would probably only initiate a small short-term correction to improve the bullish trend. Trading this correction may be risky.
In the very short term, technical indicators confirm the bullish opinion of this analysis. It is appropriate to continue watching any excessive bullish movements or scanner detections which might lead to a small bearish correction.
Force
0
10
4.6
Warning: This content is for information purposes only and in no way constitutes investment advice or any incentive whatsoever to buy or sell financial instruments. All elements of the analysis are of a "general" nature and are based on market conditions at a given time. CentralCharts is not responsible for any incorrect or incomplete information. Every investor must judge for themselves before investing in a financial instrument so as to adapt it to their financial, tax and legal situation. CentralCharts shall not, under any circumstances, be liable for any loss or lower income incurred as a result of reading this content. Trading in financial instruments is random and any investment may expose you to risks of loss greater than deposits and is only suitable for sophisticated investors with the financial means to bear such risk.

This analysis was given by Vincent Launay. Take part yourself by sharing additional analysis on another time unit:
Additional analysis
Quotes
The CAD/HUF price is 230.02 HUF. On the day, this instrument lost -0.01% and was traded between 229.70 HUF and 230.10 HUF over the period. The price is currently at +0.14% from its lowest and -0.03% from its highest.229.70
230.10
230.02
The Central Gaps scanner detects a bearish opening marking the presence of sellers ahead of buyers at the opening but not sufficiently marked to allow the price to register a quotation gap.
Bearish opening
Type : Bearish
Timeframe : Openning
A study of price movements over other periods shows the following variations:
Near a new HIGH record (5 years)
Type : Bullish
Timeframe : Weekly
Near a new HIGH record (1st january)
Type : Bullish
Timeframe : Weekly
Technical
Technical analysis of this Daily chart of CAD/HUF indicates that the overall trend is bullish. 64.29% of the signals given by moving averages are bullish. The overall trend is reinforced by the strong bullish signals from short-term moving averages. The Central Indicators scanner does not detect any result on moving averages that would impact this trend.
In fact, according to the parameters integrated into the Central Analyzer system, only 9 technical indicators out of 18 analysed are currently bullish. Central Indicators, the detector scanner for these technical indicators recently detected a signal:
Price is back under the pivot point
Type : Bearish
Timeframe : Daily
An analysis of the price chart with the Central Patterns scanner (detector of chart patterns and resistances and supports) shows a result that can have an impact on the price change:
Near resistance of channel
Type : Bearish
Timeframe : Daily
Central Candlesticks, the scanner specialised in Japanese candlesticks, detects a bearish signal that could support the hypothesis of a small drop in the very short term:
Bearish engulfing lines
Type : Bearish
Timeframe : Daily
ProTrendLines
S3
S2
S1
R1
R2
R3
Price
| S3 | S2 | S1 | Price | R1 | R2 | R3 | |
|---|---|---|---|---|---|---|---|
| ProTrendLines | 224.77 | 226.63 | 229.89 | 230.02 | 232.15 | 236.51 | 238.71 |
| Change (%) | -2.28% | -1.47% | -0.06% | - | +0.93% | +2.82% | +3.78% |
| Change | -5.25 | -3.39 | -0.13 | - | +2.13 | +6.49 | +8.69 |
| Level | Minor | Intermediate | Intermediate | - | Major | Intermediate | Major |
Attention could also be paid to pivot points to set price objectives:
Daily
| Pivot points | S3 | S2 | S1 | PP | R1 | R2 | R3 |
|---|---|---|---|---|---|---|---|
| Standard | 225.60 | 227.56 | 228.81 | 230.77 | 232.02 | 233.98 | 235.23 |
| Camarilla | 229.17 | 229.46 | 229.76 | 230.05 | 230.34 | 230.64 | 230.93 |
| Woodie | 225.24 | 227.38 | 228.45 | 230.59 | 231.66 | 233.80 | 234.87 |
| Fibonacci | 227.56 | 228.79 | 229.55 | 230.77 | 232.00 | 232.76 | 233.98 |
Weekly
| Pivot points | S3 | S2 | S1 | PP | R1 | R2 | R3 |
|---|---|---|---|---|---|---|---|
| Standard | 224.36 | 226.54 | 229.03 | 231.21 | 233.70 | 235.88 | 238.37 |
| Camarilla | 230.25 | 230.67 | 231.10 | 231.53 | 231.96 | 232.39 | 232.81 |
| Woodie | 224.53 | 226.62 | 229.20 | 231.29 | 233.87 | 235.96 | 238.54 |
| Fibonacci | 226.54 | 228.32 | 229.42 | 231.21 | 232.99 | 234.09 | 235.88 |
Monthly
| Pivot points | S3 | S2 | S1 | PP | R1 | R2 | R3 |
|---|---|---|---|---|---|---|---|
| Standard | 217.25 | 220.47 | 226.52 | 229.74 | 235.79 | 239.01 | 245.06 |
| Camarilla | 230.03 | 230.88 | 231.73 | 232.58 | 233.43 | 234.28 | 235.13 |
| Woodie | 218.68 | 221.18 | 227.95 | 230.45 | 237.22 | 239.72 | 246.49 |
| Fibonacci | 220.47 | 224.01 | 226.20 | 229.74 | 233.28 | 235.47 | 239.01 |
Numerical data
The following is the status of the technical indicators and moving averages at the time of publication of this technical analysis:
Technical indicators
Moving averages
| RSI (14): | 52.40 | |
| MACD (12,26,9): | 0.6600 | |
| Directional Movement: | 4.12 | |
| AROON (14): | 71.43 | |
| DEMA (21): | 230.27 | |
| Parabolic SAR (0,02-0,02-0,2): | 229.36 | |
| Elder Ray (13): | -0.13 | |
| Super Trend (3,10): | 224.99 | |
| Zig ZAG (10): | 229.90 | |
| VORTEX (21): | 1.0700 | |
| Stochastique (14,3,5): | 64.64 | |
| TEMA (21): | 231.17 | |
| Williams %R (14): | -44.70 | |
| Chande Momentum Oscillator (20): | 2.51 | |
| Repulse (5,40,3): | -0.5700 | |
| ROCnROLL: | -1 | |
| TRIX (15,9): | 0.0200 | |
| Courbe Coppock: | 3.97 |
| MA7: | 231.02 | |
| MA20: | 228.72 | |
| MA50: | 229.33 | |
| MA100: | 229.39 | |
| MAexp7: | 230.45 | |
| MAexp20: | 229.62 | |
| MAexp50: | 229.40 | |
| MAexp100: | 229.36 | |
| Price / MA7: | -0.43% | |
| Price / MA20: | +0.57% | |
| Price / MA50: | +0.30% | |
| Price / MA100: | +0.27% | |
| Price / MAexp7: | -0.19% | |
| Price / MAexp20: | +0.17% | |
| Price / MAexp50: | +0.27% | |
| Price / MAexp100: | +0.29% |
Quotes :
2020-07-07 06:40:11
-
Real time data
-
Forex
This member declared not having a position on this financial instrument or a related financial instrument.
About author

Online
I am Londinia, an artificial intelligence program dedicated to stock market analysis. I am able to analyse and interpret graphical and market data. Learn more…


Add a comment
Comments
0 comments on the analysis CAD/HUF - Daily