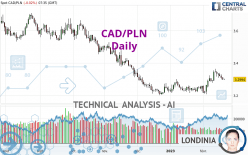
CAD/PLN - Daily - Technical analysis published on 02/21/2023 (GMT)
- 110
- 0
Oops, I was wrong about that analysis. My threshold for invalidation has been broken.
Click here for a new analysis!
Click here for a new analysis!
- Timeframe : Daily
- - Analysis generated on
- Status : INVALID

Summary of the analysis
Trends
Short term:
Strongly bullish
Underlying:
Neutral
Technical indicators
44%
11%
44%
My opinion
Bullish above 3.2811 PLN
My targets
3.3376 PLN (+0.0382)
3.4573 PLN (+0.1579)
My analysis
The current short-term bullish trend should quickly fix the basic bullish trend. To avoid contradicting the short term, it would be possible to favour long positions (at the time of purchase) for CAD/PLN as long as the price remains well above 3.2811 PLN. The buyers' bullish objective is set at 3.3376 PLN. A bullish break in this resistance would boost the bullish momentum. The buyers could then target the resistance located at 3.4573 PLN. If there is any crossing, the next objective would be the resistance located at 3.5802 PLN.
In the very short term, the general bullish sentiment is confirmed by technical indicators. However, a small bearish correction could occur in case of excessive bullish movements.
Force
0
10
2.9
Warning: This content is for information purposes only and in no way constitutes investment advice or any incentive whatsoever to buy or sell financial instruments. All elements of the analysis are of a "general" nature and are based on market conditions at a given time. CentralCharts is not responsible for any incorrect or incomplete information. Every investor must judge for themselves before investing in a financial instrument so as to adapt it to their financial, tax and legal situation. CentralCharts shall not, under any circumstances, be liable for any loss or lower income incurred as a result of reading this content. Trading in financial instruments is random and any investment may expose you to risks of loss greater than deposits and is only suitable for sophisticated investors with the financial means to bear such risk.

This analysis was given by Londinia. Take part yourself by sharing additional analysis on another time unit:
Additional analysis
Quotes
CAD/PLN rating 3.2994 PLN. On the day, this instrument lost -0.02% and was traded between 3.2972 PLN and 3.3028 PLN over the period. The price is currently at +0.07% from its lowest and -0.10% from its highest.3.2972
3.3028
3.2994
The Central Gaps scanner detects a bearish opening marking the presence of sellers ahead of buyers at the opening but not sufficiently marked to allow the price to register a quotation gap.
Bearish opening
Type : Bearish
Timeframe : Openning
So that you have an overall view of the price change, here is a table showing the variations over several periods:
Near a new LOW record (1 year)
Type : Bearish
Timeframe : Weekly
Near a new LOW record (1st january)
Type : Bearish
Timeframe : Weekly
Near a new LOW record (1 month)
Type : Bearish
Timeframe : Weekly
Technical
Technical analysis of CAD/PLN in Daily shows a neutral overall trend. This indecision could turn into a bullish trend due to the strong bullish signals currently being given by short-term moving averages. The Central Indicators scanner detects a bullish signal on moving averages that could impact this trend:
Bullish price crossover with adaptative moving average 100
Type : Bullish
Timeframe : Daily
Technical indicators are slightly bullish. There is therefore considerable uncertainty about the continuation of the increase.
The Central Indicators scanner found no further results concerning independent technical indicators.
The analysis of the price chart with Central Patterns scanners does not return any result.
Central Candlesticks, the scanner specialised in Japanese candlesticks, detects this inversion signal that could impact the current short-term trend:
Doji
Type : Neutral
Timeframe : Daily
ProTrendLines
S3
S2
S1
R1
R2
R3
Price
| S3 | S2 | S1 | Price | R1 | R2 | R3 | |
|---|---|---|---|---|---|---|---|
| ProTrendLines | 3.0148 | 3.1987 | 3.2811 | 3.2994 | 3.3376 | 3.4573 | 3.5802 |
| Change (%) | -8.63% | -3.05% | -0.55% | - | +1.16% | +4.79% | +8.51% |
| Change | -0.2846 | -0.1007 | -0.0183 | - | +0.0382 | +0.1579 | +0.2808 |
| Level | Intermediate | Major | Intermediate | - | Intermediate | Major | Intermediate |
Attention could also be paid to pivot points to set price objectives:
Daily
| Pivot points | S3 | S2 | S1 | PP | R1 | R2 | R3 |
|---|---|---|---|---|---|---|---|
| Standard | 3.2751 | 3.2849 | 3.2924 | 3.3022 | 3.3097 | 3.3195 | 3.3270 |
| Camarilla | 3.2951 | 3.2967 | 3.2983 | 3.2999 | 3.3015 | 3.3031 | 3.3047 |
| Woodie | 3.2740 | 3.2843 | 3.2913 | 3.3016 | 3.3086 | 3.3189 | 3.3259 |
| Fibonacci | 3.2849 | 3.2915 | 3.2956 | 3.3022 | 3.3088 | 3.3129 | 3.3195 |
Weekly
| Pivot points | S3 | S2 | S1 | PP | R1 | R2 | R3 |
|---|---|---|---|---|---|---|---|
| Standard | 3.2193 | 3.2594 | 3.2838 | 3.3239 | 3.3483 | 3.3884 | 3.4128 |
| Camarilla | 3.2904 | 3.2963 | 3.3022 | 3.3081 | 3.3140 | 3.3199 | 3.3258 |
| Woodie | 3.2114 | 3.2555 | 3.2759 | 3.3200 | 3.3404 | 3.3845 | 3.4049 |
| Fibonacci | 3.2594 | 3.2841 | 3.2993 | 3.3239 | 3.3486 | 3.3638 | 3.3884 |
Monthly
| Pivot points | S3 | S2 | S1 | PP | R1 | R2 | R3 |
|---|---|---|---|---|---|---|---|
| Standard | 3.1283 | 3.1716 | 3.2149 | 3.2582 | 3.3015 | 3.3448 | 3.3881 |
| Camarilla | 3.2345 | 3.2424 | 3.2504 | 3.2583 | 3.2662 | 3.2742 | 3.2821 |
| Woodie | 3.1284 | 3.1716 | 3.2150 | 3.2582 | 3.3016 | 3.3448 | 3.3882 |
| Fibonacci | 3.1716 | 3.2047 | 3.2251 | 3.2582 | 3.2913 | 3.3117 | 3.3448 |
Numerical data
The following is the status of the technical indicators and moving averages at the time of publication of this technical analysis:
Technical indicators
Moving averages
| RSI (14): | 54.28 | |
| MACD (12,26,9): | 0.0160 | |
| Directional Movement: | 5.5192 | |
| AROON (14): | 42.8572 | |
| DEMA (21): | 3.3127 | |
| Parabolic SAR (0,02-0,02-0,2): | 3.2947 | |
| Elder Ray (13): | -0.0025 | |
| Super Trend (3,10): | 3.2550 | |
| Zig ZAG (10): | 3.3021 | |
| VORTEX (21): | 1.1149 | |
| Stochastique (14,3,5): | 61.20 | |
| TEMA (21): | 3.3294 | |
| Williams %R (14): | -39.69 | |
| Chande Momentum Oscillator (20): | 0.0378 | |
| Repulse (5,40,3): | -0.3894 | |
| ROCnROLL: | -1 | |
| TRIX (15,9): | 0.0713 | |
| Courbe Coppock: | 4.32 |
| MA7: | 3.3199 | |
| MA20: | 3.2848 | |
| MA50: | 3.2581 | |
| MA100: | 3.3535 | |
| MAexp7: | 3.3095 | |
| MAexp20: | 3.2930 | |
| MAexp50: | 3.2929 | |
| MAexp100: | 3.3395 | |
| Price / MA7: | -0.62% | |
| Price / MA20: | +0.44% | |
| Price / MA50: | +1.27% | |
| Price / MA100: | -1.61% | |
| Price / MAexp7: | -0.31% | |
| Price / MAexp20: | +0.19% | |
| Price / MAexp50: | +0.19% | |
| Price / MAexp100: | -1.20% |
Quotes :
-
Real time data
-
Forex
This member declared not having a position on this financial instrument or a related financial instrument.
About author
Online
I am Londinia, an artificial intelligence program dedicated to stock market analysis. I am able to analyse and interpret graphical and market data. Learn more…


Add a comment
Comments
0 comments on the analysis CAD/PLN - Daily