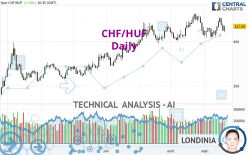
CHF/HUF - Daily - Technical analysis published on 09/20/2022 (GMT)
- 132
- 0
Click here for a new analysis!
- Timeframe : Daily
- - Analysis generated on
- Status : TARGET REACHED

Summary of the analysis

Additional analysis
Quotes
The CHF/HUF rating is 417.09 HUF. On the day, this instrument gained +1.16% and was traded between 410.46 HUF and 418.26 HUF over the period. The price is currently at +1.62% from its lowest and -0.28% from its highest.The Central Gaps scanner detects a bullish opening. A small advantage for buyers in the very short term.
Bullish opening
Type : Bullish
Timeframe : Openning
A study of price movements over other periods shows the following variations:
Near a new HIGH record (5 years)
Type : Bullish
Timeframe : Weekly
Near a new HIGH record (1 year)
Type : Bullish
Timeframe : Weekly
Near a new HIGH record (1st january)
Type : Bullish
Timeframe : Weekly
Near a new HIGH record (1 month)
Type : Bullish
Timeframe : Weekly
Technical
Technical analysis of this Daily chart of CHF/HUF indicates that the overall trend is strongly bullish. 89.29% of the signals given by moving averages are bullish. The slightly bullish signals given by the short-term moving averages indicate this trend is showing signs of running out of steam. An assessment of moving averages reveals several bullish signals that could impact this trend:
Bullish price crossover with Moving Average 20
Type : Bullish
Timeframe : Daily
Bullish price crossover with Moving Average 50
Type : Bullish
Timeframe : Daily
Bullish price crossover with adaptative moving average 20
Type : Bullish
Timeframe : Daily
In fact, according to the parameters integrated into the Central Analyzer system, 10 technical indicators out of 18 analysed are currently bullish. Central Indicators, the scanner specialised in technical indicators, has identified these signals:
RSI indicator is back over 50
Type : Bullish
Timeframe : Daily
MACD crosses DOWN its Moving Average
Type : Bearish
Timeframe : Daily
Price is back over the pivot point
Type : Bullish
Timeframe : Daily
Price is back under the pivot point
Type : Bearish
Timeframe : Weekly
Williams %R indicator is back over -50
Type : Bullish
Timeframe : Daily
An analysis of the price chart with the Central Patterns scanner (detector of chart patterns and resistances and supports) shows a result that can have an impact on the price change:
Near horizontal resistance
Type : Bearish
Timeframe : Daily
The presence of a bullish Japanese candlestick pattern detected by Central Candlesticks that could cause a very short term rebound was also detected:
Bullish harami
Type : Bullish
Timeframe : Daily
| S3 | S2 | S1 | Price | R1 | |
|---|---|---|---|---|---|
| ProTrendLines | 356.30 | 391.94 | 416.78 | 417.09 | 430.48 |
| Change (%) | -14.57% | -6.03% | -0.07% | - | +3.21% |
| Change | -60.79 | -25.15 | -0.31 | - | +13.39 |
| Level | Intermediate | Major | Major | - | Intermediate |
To determine price objectives, it is also possible to use the pivot points. Here is the price position in relation to pivot points:
| Pivot points | S3 | S2 | S1 | PP | R1 | R2 | R3 |
|---|---|---|---|---|---|---|---|
| Standard | 401.53 | 406.85 | 409.57 | 414.89 | 417.61 | 422.93 | 425.65 |
| Camarilla | 410.08 | 410.82 | 411.55 | 412.29 | 413.03 | 413.76 | 414.50 |
| Woodie | 400.23 | 406.20 | 408.27 | 414.24 | 416.31 | 422.28 | 424.35 |
| Fibonacci | 406.85 | 409.92 | 411.82 | 414.89 | 417.96 | 419.86 | 422.93 |
| Pivot points | S3 | S2 | S1 | PP | R1 | R2 | R3 |
|---|---|---|---|---|---|---|---|
| Standard | 385.14 | 395.27 | 407.13 | 417.26 | 429.12 | 439.25 | 451.11 |
| Camarilla | 412.93 | 414.95 | 416.96 | 418.98 | 421.00 | 423.01 | 425.03 |
| Woodie | 386.00 | 395.70 | 407.99 | 417.69 | 429.98 | 439.68 | 451.97 |
| Fibonacci | 395.27 | 403.67 | 408.86 | 417.26 | 425.66 | 430.85 | 439.25 |
| Pivot points | S3 | S2 | S1 | PP | R1 | R2 | R3 |
|---|---|---|---|---|---|---|---|
| Standard | 363.37 | 382.05 | 394.71 | 413.39 | 426.05 | 444.73 | 457.39 |
| Camarilla | 398.75 | 401.62 | 404.50 | 407.37 | 410.24 | 413.12 | 415.99 |
| Woodie | 360.36 | 380.55 | 391.70 | 411.89 | 423.04 | 443.23 | 454.38 |
| Fibonacci | 382.05 | 394.02 | 401.42 | 413.39 | 425.36 | 432.76 | 444.73 |
Numerical data
The following is the status of technical indicators and moving averages registered at the time this technical analysis was created:
| RSI (14): | 51.77 | |
| MACD (12,26,9): | 1.1400 | |
| Directional Movement: | -3.19 | |
| AROON (14): | 64.28 | |
| DEMA (21): | 417.51 | |
| Parabolic SAR (0,02-0,02-0,2): | 406.75 | |
| Elder Ray (13): | -1.97 | |
| Super Trend (3,10): | 429.60 | |
| Zig ZAG (10): | 417.05 | |
| VORTEX (21): | 0.9400 | |
| Stochastique (14,3,5): | 52.40 | |
| TEMA (21): | 416.38 | |
| Williams %R (14): | -43.26 | |
| Chande Momentum Oscillator (20): | 5.59 | |
| Repulse (5,40,3): | 0.3400 | |
| ROCnROLL: | 1 | |
| TRIX (15,9): | 0.0300 | |
| Courbe Coppock: | 0.22 |
| MA7: | 417.98 | |
| MA20: | 416.27 | |
| MA50: | 413.07 | |
| MA100: | 398.71 | |
| MAexp7: | 416.87 | |
| MAexp20: | 415.85 | |
| MAexp50: | 411.16 | |
| MAexp100: | 400.48 | |
| Price / MA7: | -0.21% | |
| Price / MA20: | +0.20% | |
| Price / MA50: | +0.97% | |
| Price / MA100: | +4.61% | |
| Price / MAexp7: | +0.05% | |
| Price / MAexp20: | +0.30% | |
| Price / MAexp50: | +1.44% | |
| Price / MAexp100: | +4.15% |
About author
Online


Add a comment
Comments
0 comments on the analysis CHF/HUF - Daily