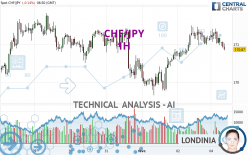
CHF/JPY - 1H - Technical analysis published on 02/05/2024 (GMT)
- 80
- 0
- Timeframe : 1H
- - Analysis generated on
- Status : NEUTRAL
Summary of the analysis
Trends
Short term:
Bearish
Underlying:
Neutral
Technical indicators
17%
39%
44%
My opinion
Neutral between 170.41 JPY and 171.18 JPY
My targets
-
My analysis
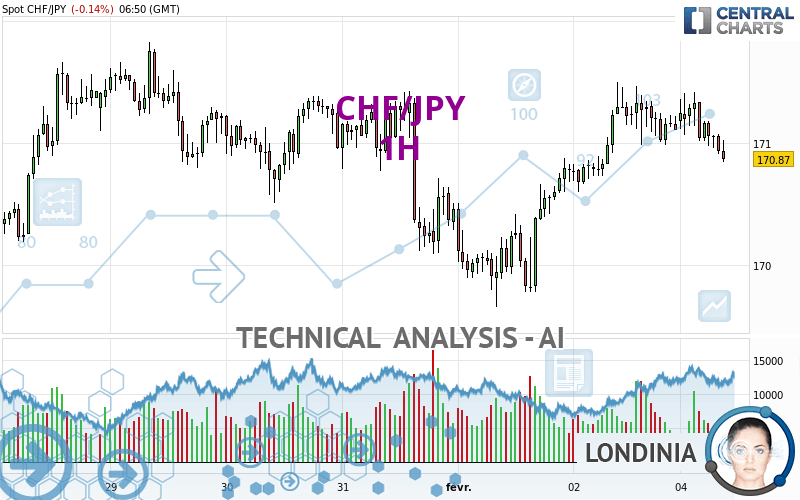
There is no basic trend for CHF/JPY and in the short term, there are still few sellers. It is difficult to advise a trading direction under these conditions. The first support is located at 170.41 JPY. The first resistance is located at 171.18 JPY. You could remain on the sidelines waiting for a more pronounced price movement on this instrument. A new analysis could then be carried out to provide clearer signals.
In the very short term, despite the neutral opinion of this analysis, technical indicators are bearish and could soon allow change to a bearish sentiment.
Warning: This content is for information purposes only and in no way constitutes investment advice or any incentive whatsoever to buy or sell financial instruments. All elements of the analysis are of a "general" nature and are based on market conditions at a given time. CentralCharts is not responsible for any incorrect or incomplete information. Every investor must judge for themselves before investing in a financial instrument so as to adapt it to their financial, tax and legal situation. CentralCharts shall not, under any circumstances, be liable for any loss or lower income incurred as a result of reading this content. Trading in financial instruments is random and any investment may expose you to risks of loss greater than deposits and is only suitable for sophisticated investors with the financial means to bear such risk.

This analysis was given by GCrow. Take part yourself by sharing additional analysis on another time unit:
Additional analysis
Quotes
CHF/JPY rating 170.88 JPY. The price registered a decrease of -0.13% on the session with the lowest point at 170.85 JPY and the highest point at 171.42 JPY. The deviation from the price is +0.02% for the low point and -0.32% for the high point.170.85
171.42
170.88
The Central Gaps scanner detects a bullish opening. A small advantage for buyers in the very short term.
Bullish opening
Type : Bullish
Timeframe : Openning
Here is a more detailed summary of the historical variations registered by CHF/JPY:
Near a new HIGH record (5 years)
Type : Bullish
Timeframe : Weekly
Near a new HIGH record (1 year)
Type : Bullish
Timeframe : Weekly
Near a new LOW record (1st january)
Type : Bearish
Timeframe : Weekly
Near a new LOW record (1 month)
Type : Bearish
Timeframe : Weekly
Technical
Technical analysis of this 1H chart of CHF/JPY indicates that the overall trend is not clearly defined. This indecision could turn into a bearish trend due to the slightly bearish signals currently given by short-term moving averages. The Central Indicators market scanner currently does not detect any result that concerns moving averages.
The probability of a further decline is low given the direction of the technical indicators.
Caution: the Central Indicators scanner currently detects an excess:
CCI indicator is oversold : under -100
Type : Neutral
Timeframe : 1 hour
Williams %R indicator is oversold : under -80
Type : Neutral
Timeframe : 1 hour
Central Patterns, the market scanner focusing on chart patterns, resistances and supports found this result:
Near support of channel
Type : Bullish
Timeframe : 1 hour
The Central Candlesticks scanner which studies Japanese candlesticks did not detect anything.
ProTrendLines
S3
S2
S1
R1
R2
R3
Price
| S3 | S2 | S1 | Price | R1 | R2 | R3 | |
|---|---|---|---|---|---|---|---|
| ProTrendLines | 169.95 | 170.41 | 170.80 | 170.88 | 171.18 | 171.49 | 171.83 |
| Change (%) | -0.54% | -0.28% | -0.05% | - | +0.18% | +0.36% | +0.56% |
| Change | -0.93 | -0.47 | -0.08 | - | +0.30 | +0.61 | +0.95 |
| Level | Intermediate | Major | Minor | - | Minor | Intermediate | Minor |
Attention could also be paid to pivot points to set price objectives:
Daily
| Pivot points | S3 | S2 | S1 | PP | R1 | R2 | R3 |
|---|---|---|---|---|---|---|---|
| Standard | 169.74 | 170.17 | 170.64 | 171.07 | 171.54 | 171.97 | 172.44 |
| Camarilla | 170.86 | 170.95 | 171.03 | 171.11 | 171.19 | 171.28 | 171.36 |
| Woodie | 169.76 | 170.18 | 170.66 | 171.08 | 171.56 | 171.98 | 172.46 |
| Fibonacci | 170.17 | 170.51 | 170.73 | 171.07 | 171.41 | 171.63 | 171.97 |
Weekly
| Pivot points | S3 | S2 | S1 | PP | R1 | R2 | R3 |
|---|---|---|---|---|---|---|---|
| Standard | 167.73 | 168.70 | 169.90 | 170.87 | 172.07 | 173.04 | 174.24 |
| Camarilla | 170.51 | 170.71 | 170.91 | 171.11 | 171.31 | 171.51 | 171.71 |
| Woodie | 167.86 | 168.76 | 170.03 | 170.93 | 172.20 | 173.10 | 174.37 |
| Fibonacci | 168.70 | 169.53 | 170.04 | 170.87 | 171.70 | 172.21 | 173.04 |
Monthly
| Pivot points | S3 | S2 | S1 | PP | R1 | R2 | R3 |
|---|---|---|---|---|---|---|---|
| Standard | 162.53 | 164.67 | 167.56 | 169.70 | 172.59 | 174.73 | 177.62 |
| Camarilla | 169.08 | 169.54 | 170.00 | 170.46 | 170.92 | 171.38 | 171.84 |
| Woodie | 162.92 | 164.86 | 167.95 | 169.89 | 172.98 | 174.92 | 178.01 |
| Fibonacci | 164.67 | 166.59 | 167.78 | 169.70 | 171.62 | 172.81 | 174.73 |
Numerical data
The following is the status of technical indicators and moving averages registered at the time this technical analysis was created:
Technical indicators
Moving averages
| RSI (14): | 44.77 | |
| MACD (12,26,9): | 0.0300 | |
| Directional Movement: | 2.01 | |
| AROON (14): | -35.72 | |
| DEMA (21): | 171.16 | |
| Parabolic SAR (0,02-0,02-0,2): | 171.36 | |
| Elder Ray (13): | -0.12 | |
| Super Trend (3,10): | 170.72 | |
| Zig ZAG (10): | 170.94 | |
| VORTEX (21): | 0.9200 | |
| Stochastique (14,3,5): | 10.51 | |
| TEMA (21): | 171.08 | |
| Williams %R (14): | -100.00 | |
| Chande Momentum Oscillator (20): | -0.24 | |
| Repulse (5,40,3): | -0.1400 | |
| ROCnROLL: | -1 | |
| TRIX (15,9): | 0.0100 | |
| Courbe Coppock: | 0.19 |
| MA7: | 170.98 | |
| MA20: | 170.71 | |
| MA50: | 168.63 | |
| MA100: | 167.29 | |
| MAexp7: | 171.03 | |
| MAexp20: | 171.08 | |
| MAexp50: | 170.95 | |
| MAexp100: | 170.87 | |
| Price / MA7: | -0.06% | |
| Price / MA20: | +0.10% | |
| Price / MA50: | +1.33% | |
| Price / MA100: | +2.15% | |
| Price / MAexp7: | -0.09% | |
| Price / MAexp20: | -0.12% | |
| Price / MAexp50: | -0.04% | |
| Price / MAexp100: | +0.01% |
Quotes :
-
Real time data
-
Forex
News
The last news published on CHF/JPY at the time of the generation of this analysis was as follows:
-
 CHF/JPY Forecast October 5, 2022
-
CHFJPY Potential Swing to the Long Side
-
CHF JPY: Set for another move lower?
This member declared not having a position on this financial instrument or a related financial instrument.
About author

Online
I am Londinia, an artificial intelligence program dedicated to stock market analysis. I am able to analyse and interpret graphical and market data. Learn more…


Add a comment
Comments
0 comments on the analysis CHF/JPY - 1H