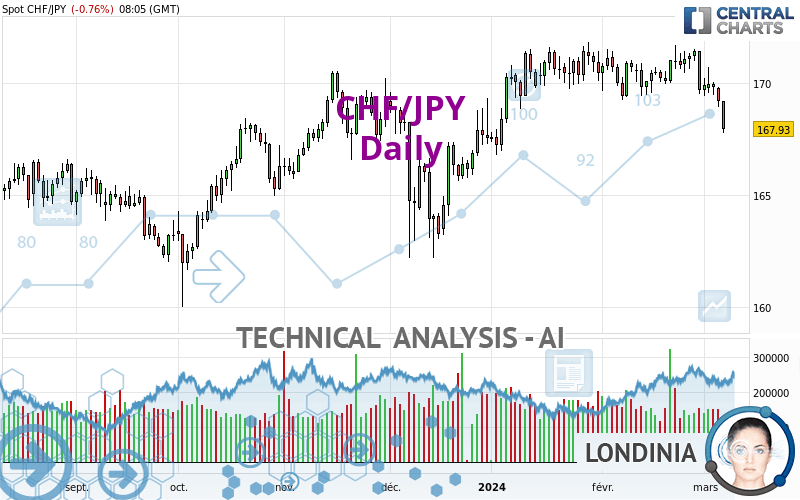
CHF/JPY - Daily - Technical analysis published on 03/07/2024 (GMT)
- 79
- 0
Click here for a new analysis!
- Timeframe : Daily
- - Analysis generated on
- Status : LEVEL MAINTAINED
Summary of the analysis

Additional analysis
Quotes
The CHF/JPY price is 167.94 JPY. On the day, this instrument lost -0.76% and was traded between 167.78 JPY and 169.22 JPY over the period. The price is currently at +0.10% from its lowest and -0.76% from its highest.So that you have an overall view of the price change, here is a table showing the variations over several periods:
Near a new HIGH record (5 years)
Type : Bullish
Timeframe : Weekly
Near a new HIGH record (1 year)
Type : Bullish
Timeframe : Weekly
Near a new HIGH record (1st january)
Type : Bullish
Timeframe : Weekly
Near a new HIGH record (1 month)
Type : Bullish
Timeframe : Weekly
New LOW record (1 month)
Type : Bearish
Timeframe : Weekly
Technical
Technical analysis of CHF/JPY in Daily shows an overall slightly bearish trend. 53.57% of the signals given by moving averages are bearish. This slightly bearish trend could be reinforced by the strong bearish signals given by short-term moving averages. The Central Indicators scanner detects bearish signals on moving averages that could impact this trend:
Bearish price crossover with Moving Average 100
Type : Bearish
Timeframe : Daily
Bearish price crossover with adaptative moving average 50
Type : Bearish
Timeframe : Daily
Bearish price crossover with adaptative moving average 100
Type : Bearish
Timeframe : Daily
An assessment of technical indicators shows a bearish signal.
Caution: the Central Indicators scanner currently detects an excess:
CCI indicator is oversold : under -100
Type : Neutral
Timeframe : Daily
Williams %R indicator is oversold : under -80
Type : Neutral
Timeframe : Daily
Pivot points : price is under support 3
Type : Neutral
Timeframe : Daily
Pivot points : price is under support 3
Type : Neutral
Timeframe : Weekly
SuperTrend indicator bearish reversal
Type : Bearish
Timeframe : Daily
The Central Patterns scanner, which studies chart patterns, resistances and supports, has identified these signals:
Near horizontal support
Type : Bullish
Timeframe : Daily
Support of channel is broken
Type : Bearish
Timeframe : Daily
The Central Candlesticks scanner which studies Japanese candlesticks did not detect anything.
| S3 | S2 | S1 | Price | R1 | |
|---|---|---|---|---|---|
| ProTrendLines | 159.80 | 163.26 | 166.45 | 167.94 | 171.44 |
| Change (%) | -4.85% | -2.79% | -0.89% | - | +2.08% |
| Change | -8.14 | -4.68 | -1.49 | - | +3.50 |
| Level | Minor | Major | Major | - | Major |
To determine price objectives, it is also possible to use the pivot points. Here is the price position in relation to pivot points:
| Pivot points | S3 | S2 | S1 | PP | R1 | R2 | R3 |
|---|---|---|---|---|---|---|---|
| Standard | 167.93 | 168.43 | 168.82 | 169.32 | 169.71 | 170.21 | 170.60 |
| Camarilla | 168.98 | 169.06 | 169.14 | 169.22 | 169.30 | 169.38 | 169.47 |
| Woodie | 167.89 | 168.40 | 168.78 | 169.29 | 169.67 | 170.18 | 170.56 |
| Fibonacci | 168.43 | 168.77 | 168.98 | 169.32 | 169.66 | 169.87 | 170.21 |
| Pivot points | S3 | S2 | S1 | PP | R1 | R2 | R3 |
|---|---|---|---|---|---|---|---|
| Standard | 166.94 | 168.17 | 169.05 | 170.28 | 171.16 | 172.39 | 173.27 |
| Camarilla | 169.34 | 169.53 | 169.73 | 169.92 | 170.11 | 170.31 | 170.50 |
| Woodie | 166.76 | 168.08 | 168.87 | 170.19 | 170.98 | 172.30 | 173.09 |
| Fibonacci | 168.17 | 168.98 | 169.48 | 170.28 | 171.09 | 171.59 | 172.39 |
| Pivot points | S3 | S2 | S1 | PP | R1 | R2 | R3 |
|---|---|---|---|---|---|---|---|
| Standard | 166.29 | 167.77 | 168.73 | 170.21 | 171.17 | 172.65 | 173.61 |
| Camarilla | 169.01 | 169.23 | 169.46 | 169.68 | 169.90 | 170.13 | 170.35 |
| Woodie | 166.02 | 167.64 | 168.46 | 170.08 | 170.90 | 172.52 | 173.34 |
| Fibonacci | 167.77 | 168.71 | 169.28 | 170.21 | 171.15 | 171.72 | 172.65 |
Numerical data
The following are the details of the technical indicators and moving averages that were collected to generate this technical analysis:
| RSI (14): | 33.48 | |
| MACD (12,26,9): | -0.2500 | |
| Directional Movement: | -13.19 | |
| AROON (14): | -71.43 | |
| DEMA (21): | 169.88 | |
| Parabolic SAR (0,02-0,02-0,2): | 171.25 | |
| Elder Ray (13): | -1.32 | |
| Super Trend (3,10): | 171.49 | |
| Zig ZAG (10): | 167.95 | |
| VORTEX (21): | 0.9300 | |
| Stochastique (14,3,5): | 9.60 | |
| TEMA (21): | 169.34 | |
| Williams %R (14): | -99.47 | |
| Chande Momentum Oscillator (20): | -2.14 | |
| Repulse (5,40,3): | -1.3600 | |
| ROCnROLL: | 2 | |
| TRIX (15,9): | 0.0000 | |
| Courbe Coppock: | 0.84 |
| MA7: | 169.71 | |
| MA20: | 170.28 | |
| MA50: | 170.22 | |
| MA100: | 168.73 | |
| MAexp7: | 169.46 | |
| MAexp20: | 170.07 | |
| MAexp50: | 169.75 | |
| MAexp100: | 168.26 | |
| Price / MA7: | -1.04% | |
| Price / MA20: | -1.37% | |
| Price / MA50: | -1.34% | |
| Price / MA100: | -0.47% | |
| Price / MAexp7: | -0.90% | |
| Price / MAexp20: | -1.25% | |
| Price / MAexp50: | -1.07% | |
| Price / MAexp100: | -0.19% |
News
Don't forget to follow the news on CHF/JPY. At the time of publication of this analysis, the latest news was as follows:
-
 CHF/JPY Forecast February 26, 2024
-
CHF/JPY Forecast October 5, 2022
-
CHFJPY Potential Swing to the Long Side
-
CHF JPY: Set for another move lower?
About author

Online


Add a comment
Comments
0 comments on the analysis CHF/JPY - Daily