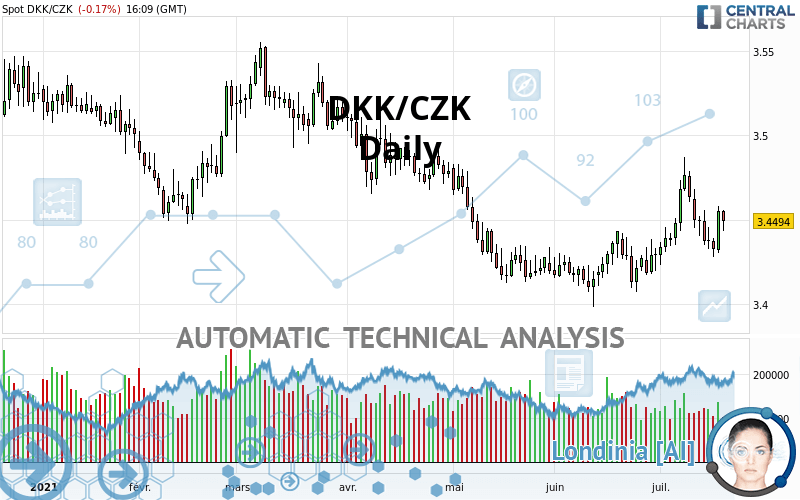
DKK/CZK - Daily - Technical analysis published on 07/20/2021 (GMT)
- 186
- 0
Click here for a new analysis!
- Timeframe : Daily
- - Analysis generated on
- Status : LEVEL MAINTAINED

Summary of the analysis

Additional analysis
Quotes
DKK/CZK rating 3.4494 CZK. The price is lower by -0.17% since the last closing with the lowest point at 3.4433 CZK and the highest point at 3.4557 CZK. The deviation from the price is +0.18% for the low point and -0.18% for the high point.The Central Gaps scanner detects a bullish opening marking the presence of buyers ahead of sellers at the opening but not sufficiently marked to allow the price to register a quotation gap.
Bullish opening
Type : Bullish
Timeframe : Openning
So that you have an overall view of the price change, here is a table showing the variations over several periods:
Near a new LOW record (5 years)
Type : Bearish
Timeframe : Weekly
Technical
Technical analysis of DKK/CZK in Daily shows a neutral overall trend. The strong bullish signals currently being given by short-term moving averages could allow the overall trend to return to bullish. The Central Indicators market scanner is currently detecting several bullish signals that could impact this trend:
Bullish trend reversal : Moving Average 50
Type : Bullish
Timeframe : Daily
Bullish trend reversal : adaptative moving average 20
Type : Bullish
Timeframe : Daily
Bullish trend reversal : adaptative moving average 50
Type : Bullish
Timeframe : Daily
Bullish price crossover with Moving Average 20
Type : Bullish
Timeframe : Daily
Bullish price crossover with adaptative moving average 20
Type : Bullish
Timeframe : Daily
Bullish price crossover with adaptative moving average 50
Type : Bullish
Timeframe : Daily
In fact, only 8 technical indicators out of 18 studied are currently positioned bullish. Other results related to technical indicators were also found by the Central Indicators scanner:
RSI indicator is back over 50
Type : Bullish
Timeframe : Daily
Price is back over the pivot point
Type : Bullish
Timeframe : Daily
Price is back under the pivot point
Type : Bearish
Timeframe : Weekly
Williams %R indicator is back over -50
Type : Bullish
Timeframe : Daily
The Central Patterns scanner, which studies chart patterns, resistances and supports, has identified this signal:
Near support of channel
Type : Bullish
Timeframe : Daily
For a small rebound in the very short term, the Central Candlesticks scanner currently notes the presence of this bullish pattern in Japanese candlesticks:
Bullish engulfing lines
Type : Bullish
Timeframe : Daily
| S3 | S2 | S1 | Price | R1 | R2 | R3 | |
|---|---|---|---|---|---|---|---|
| ProTrendLines | 3.2199 | 3.3246 | 3.4079 | 3.4494 | 3.4535 | 3.5030 | 3.5520 |
| Change (%) | -6.65% | -3.62% | -1.20% | - | +0.12% | +1.55% | +2.97% |
| Change | -0.2295 | -0.1248 | -0.0415 | - | +0.0041 | +0.0536 | +0.1026 |
| Level | Intermediate | Intermediate | Major | - | Major | Major | Major |
To determine price objectives, it is also possible to use the pivot points. Here is the price position in relation to pivot points:
| Pivot points | S3 | S2 | S1 | PP | R1 | R2 | R3 |
|---|---|---|---|---|---|---|---|
| Standard | 3.4093 | 3.4198 | 3.4375 | 3.4480 | 3.4657 | 3.4762 | 3.4939 |
| Camarilla | 3.4476 | 3.4501 | 3.4527 | 3.4553 | 3.4579 | 3.4605 | 3.4631 |
| Woodie | 3.4130 | 3.4216 | 3.4412 | 3.4498 | 3.4694 | 3.4780 | 3.4976 |
| Fibonacci | 3.4198 | 3.4305 | 3.4372 | 3.4480 | 3.4587 | 3.4654 | 3.4762 |
| Pivot points | S3 | S2 | S1 | PP | R1 | R2 | R3 |
|---|---|---|---|---|---|---|---|
| Standard | 3.3768 | 3.4023 | 3.4173 | 3.4428 | 3.4578 | 3.4833 | 3.4983 |
| Camarilla | 3.4213 | 3.4250 | 3.4287 | 3.4324 | 3.4361 | 3.4398 | 3.4435 |
| Woodie | 3.3717 | 3.3997 | 3.4122 | 3.4402 | 3.4527 | 3.4807 | 3.4932 |
| Fibonacci | 3.4023 | 3.4177 | 3.4273 | 3.4428 | 3.4582 | 3.4678 | 3.4833 |
| Pivot points | S3 | S2 | S1 | PP | R1 | R2 | R3 |
|---|---|---|---|---|---|---|---|
| Standard | 3.3586 | 3.3785 | 3.4039 | 3.4238 | 3.4492 | 3.4691 | 3.4945 |
| Camarilla | 3.4169 | 3.4211 | 3.4253 | 3.4294 | 3.4336 | 3.4377 | 3.4419 |
| Woodie | 3.3615 | 3.3799 | 3.4068 | 3.4252 | 3.4521 | 3.4705 | 3.4974 |
| Fibonacci | 3.3785 | 3.3958 | 3.4065 | 3.4238 | 3.4411 | 3.4518 | 3.4691 |
Numerical data
The following is the status of the technical indicators and moving averages at the time of publication of this technical analysis:
| RSI (14): | 54.41 | |
| MACD (12,26,9): | 0.0045 | |
| Directional Movement: | 7.7358 | |
| AROON (14): | 42.8571 | |
| DEMA (21): | 3.4484 | |
| Parabolic SAR (0,02-0,02-0,2): | 3.4818 | |
| Elder Ray (13): | 0.0042 | |
| Super Trend (3,10): | 3.4272 | |
| Zig ZAG (10): | 3.4495 | |
| VORTEX (21): | 1.0459 | |
| Stochastique (14,3,5): | 37.65 | |
| TEMA (21): | 3.4529 | |
| Williams %R (14): | -59.97 | |
| Chande Momentum Oscillator (20): | 0.0096 | |
| Repulse (5,40,3): | 0.2395 | |
| ROCnROLL: | 1 | |
| TRIX (15,9): | 0.0225 | |
| Courbe Coppock: | 1.10 |
| MA7: | 3.4446 | |
| MA20: | 3.4410 | |
| MA50: | 3.4304 | |
| MA100: | 3.4636 | |
| MAexp7: | 3.4469 | |
| MAexp20: | 3.4428 | |
| MAexp50: | 3.4429 | |
| MAexp100: | 3.4585 | |
| Price / MA7: | +0.14% | |
| Price / MA20: | +0.24% | |
| Price / MA50: | +0.55% | |
| Price / MA100: | -0.41% | |
| Price / MAexp7: | +0.07% | |
| Price / MAexp20: | +0.19% | |
| Price / MAexp50: | +0.19% | |
| Price / MAexp100: | -0.26% |
About author

Online


Add a comment
Comments
0 comments on the analysis DKK/CZK - Daily