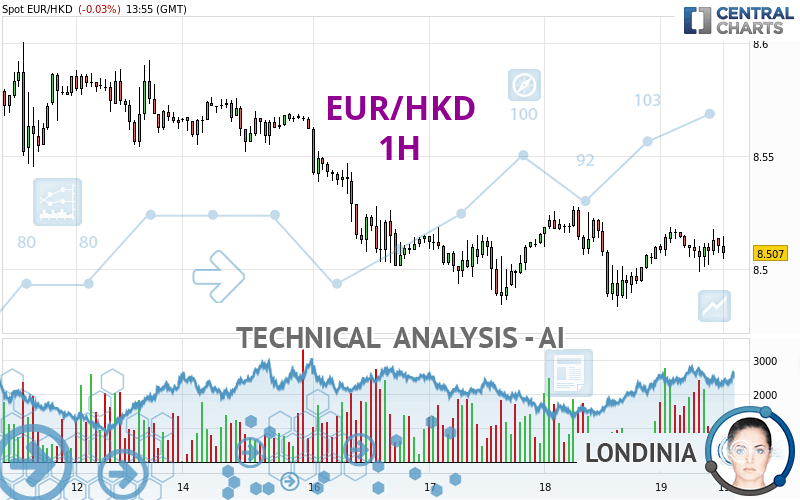
EUR/HKD - 1H - Technical analysis published on 01/19/2024 (GMT)
- 89
- 0
Click here for a new analysis!
- Timeframe : 1H
- - Analysis generated on
- Status : LEVEL MAINTAINED

Summary of the analysis

Additional analysis
Quotes
EUR/HKD rating 8.5070 HKD. On the day, this instrument lost -0.03% and was traded between 8.4986 HKD and 8.5183 HKD over the period. The price is currently at +0.10% from its lowest and -0.13% from its highest.A bullish opening was detected by the Central Gaps scanner. Buyers are trying to impose a bullish momentum in the very short term.
Bullish opening
Type : Bullish
Timeframe : Openning
So that you have an overall view of the price change, here is a table showing the variations over several periods:
Near a new LOW record (1 year)
Type : Bearish
Timeframe : Weekly
Near a new HIGH record (1st january)
Type : Bullish
Timeframe : Weekly
Near a new HIGH record (1 month)
Type : Bullish
Timeframe : Weekly
Technical
Technical analysis of this 1H chart of EUR/HKD indicates that the overall trend is strongly bearish. The signals given by moving averages are 85.71% bearish. This strongly bearish trend seems to be slowing down given the slightly bearish signals being given by short-term moving averages. An assessment of moving averages reveals several bearish and bullish signals:
Moving Average bullish crossovers : MA20 & MA50
Type : Bullish
Timeframe : 1 hour
Bearish price crossover with Moving Average 20
Type : Bearish
Timeframe : 1 hour
Bearish price crossover with Moving Average 50
Type : Bearish
Timeframe : 1 hour
The technical indicators are generally neutral. They do not provide relevant information on the direction of future price movements.
Other results related to technical indicators were also found by the Central Indicators scanner:
Pivot points : price is under support 1
Type : Neutral
Timeframe : Weekly
RSI indicator is back under 50
Type : Bearish
Timeframe : 1 hour
MACD crosses DOWN its Moving Average
Type : Bearish
Timeframe : 1 hour
Momentum indicator is back under 0
Type : Bearish
Timeframe : 1 hour
Williams %R indicator is back under -50
Type : Bearish
Timeframe : 1 hour
Central Patterns, the market scanner focusing on chart patterns, resistances and supports found these results:
Near horizontal resistance
Type : Bearish
Timeframe : 1 hour
Resistance of channel is broken
Type : Bullish
Timeframe : 1 hour
No result was found by the Central Candlesticks scanner on Japanese candlesticks.
| S3 | S2 | S1 | Price | R1 | R2 | R3 | |
|---|---|---|---|---|---|---|---|
| ProTrendLines | 8.3750 | 8.4902 | 8.5011 | 8.5070 | 8.5276 | 8.5547 | 8.5768 |
| Change (%) | -1.55% | -0.20% | -0.07% | - | +0.24% | +0.56% | +0.82% |
| Change | -0.1320 | -0.0168 | -0.0059 | - | +0.0206 | +0.0477 | +0.0698 |
| Level | Intermediate | Intermediate | Minor | - | Intermediate | Intermediate | Intermediate |
Pivot points can also be used to set your price objectives. Here is the price situation in relation to pivot points:
| Pivot points | S3 | S2 | S1 | PP | R1 | R2 | R3 |
|---|---|---|---|---|---|---|---|
| Standard | 8.4414 | 8.4622 | 8.4860 | 8.5068 | 8.5306 | 8.5514 | 8.5752 |
| Camarilla | 8.4975 | 8.5016 | 8.5057 | 8.5098 | 8.5139 | 8.5180 | 8.5221 |
| Woodie | 8.4429 | 8.4630 | 8.4875 | 8.5076 | 8.5321 | 8.5522 | 8.5767 |
| Fibonacci | 8.4622 | 8.4792 | 8.4898 | 8.5068 | 8.5238 | 8.5344 | 8.5514 |
| Pivot points | S3 | S2 | S1 | PP | R1 | R2 | R3 |
|---|---|---|---|---|---|---|---|
| Standard | 8.4549 | 8.4912 | 8.5279 | 8.5642 | 8.6009 | 8.6372 | 8.6739 |
| Camarilla | 8.5444 | 8.5511 | 8.5578 | 8.5645 | 8.5712 | 8.5779 | 8.5846 |
| Woodie | 8.4550 | 8.4913 | 8.5280 | 8.5643 | 8.6010 | 8.6373 | 8.6740 |
| Fibonacci | 8.4912 | 8.5191 | 8.5364 | 8.5642 | 8.5921 | 8.6094 | 8.6372 |
| Pivot points | S3 | S2 | S1 | PP | R1 | R2 | R3 |
|---|---|---|---|---|---|---|---|
| Standard | 8.1019 | 8.2395 | 8.4301 | 8.5677 | 8.7583 | 8.8959 | 9.0865 |
| Camarilla | 8.5304 | 8.5604 | 8.5905 | 8.6206 | 8.6507 | 8.6808 | 8.7109 |
| Woodie | 8.1283 | 8.2528 | 8.4565 | 8.5810 | 8.7847 | 8.9092 | 9.1129 |
| Fibonacci | 8.2395 | 8.3649 | 8.4424 | 8.5677 | 8.6931 | 8.7706 | 8.8959 |
Numerical data
The following are the details of the technical indicators and moving averages that were collected to generate this technical analysis:
| RSI (14): | 48.65 | |
| MACD (12,26,9): | 0.0006 | |
| Directional Movement: | -0.5986 | |
| AROON (14): | -42.8571 | |
| DEMA (21): | 8.5093 | |
| Parabolic SAR (0,02-0,02-0,2): | 8.4994 | |
| Elder Ray (13): | 0.0002 | |
| Super Trend (3,10): | 8.5276 | |
| Zig ZAG (10): | 8.5070 | |
| VORTEX (21): | 1.1079 | |
| Stochastique (14,3,5): | 59.05 | |
| TEMA (21): | 8.5107 | |
| Williams %R (14): | -52.28 | |
| Chande Momentum Oscillator (20): | -0.0060 | |
| Repulse (5,40,3): | 0.0013 | |
| ROCnROLL: | 2 | |
| TRIX (15,9): | 0.0012 | |
| Courbe Coppock: | 0.10 |
| MA7: | 8.5369 | |
| MA20: | 8.5685 | |
| MA50: | 8.5156 | |
| MA100: | 8.4168 | |
| MAexp7: | 8.5090 | |
| MAexp20: | 8.5087 | |
| MAexp50: | 8.5104 | |
| MAexp100: | 8.5194 | |
| Price / MA7: | -0.35% | |
| Price / MA20: | -0.72% | |
| Price / MA50: | -0.10% | |
| Price / MA100: | +1.07% | |
| Price / MAexp7: | -0.02% | |
| Price / MAexp20: | -0.02% | |
| Price / MAexp50: | -0.04% | |
| Price / MAexp100: | -0.15% |
About author
Online


Add a comment
Comments
0 comments on the analysis EUR/HKD - 1H