EUR/PLN - Daily - Technical analysis published on 07/02/2020 (GMT)
- Who voted?
- 70
- 0
Click here for a new analysis!
- Timeframe : Daily
- - Analysis generated on
- Status : INVALID

Summary of the analysis

Additional analysis
Quotes
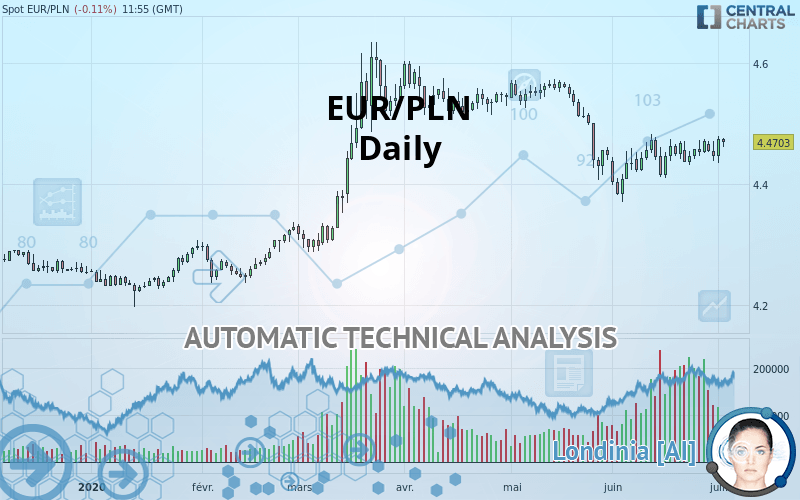
The EUR/PLN price is 4.4702 PLN. On the day, this instrument lost -0.12% with the lowest point at 4.4613 PLN and the highest point at 4.4772 PLN. The deviation from the price is +0.20% for the low point and -0.16% for the high point.The Central Gaps scanner detects a bullish opening. A small advantage for buyers in the very short term.
Bullish opening
Type : Bullish
Timeframe : Openning
Here is a more detailed summary of the historical variations registered by EUR/PLN:
Near a new HIGH record (5 years)
Type : Bullish
Timeframe : Weekly
Near a new HIGH record (1st january)
Type : Bullish
Timeframe : Weekly
The Central Volumes scanner notes the presence of abnormal volumes:
Abnormal volumes
Timeframe : 5 days
Abnormal volumes
Timeframe : 20 days
Technical
Technical analysis of EUR/PLN in Daily shows an overall bullish trend. The signals given by moving averages are 67.86% bullish. This bullish trend is slowing down slightly given the slightly bullish signals of short-term moving averages. The Central Indicators market scanner is currently detecting several bullish signals that could impact this trend:
Bullish trend reversal : adaptative moving average 20
Type : Bullish
Timeframe : Daily
Bullish trend reversal : adaptative moving average 50
Type : Bullish
Timeframe : Daily
Bullish price crossover with Moving Average 20
Type : Bullish
Timeframe : Daily
Bullish price crossover with Moving Average 100
Type : Bullish
Timeframe : Daily
Bullish price crossover with adaptative moving average 20
Type : Bullish
Timeframe : Daily
In fact, 13 technical indicators on 18 studied are currently positioned bullish. Caution: the Central Indicators scanner currently detects an excess:
Williams %R indicator is overbought : over -20
Type : Neutral
Timeframe : Daily
RSI indicator is back over 50
Type : Bullish
Timeframe : Daily
Parabolic SAR indicator bearish reversal
Type : Bearish
Timeframe : Daily
Price is back over the pivot point
Type : Bullish
Timeframe : Daily
Price is back over the pivot point
Type : Bullish
Timeframe : Weekly
Williams %R indicator is back over -50
Type : Bullish
Timeframe : Daily
The analysis of the price chart with Central Patterns scanners does not return any result.
The Central Candlesticks scanner, specialised in Japanese candlesticks, did not identify any signals.
| S3 | S2 | S1 | Price | R1 | R2 | R3 | |
|---|---|---|---|---|---|---|---|
| ProTrendLines | 4.3241 | 4.3904 | 4.4370 | 4.4702 | 4.4979 | 4.5684 | 4.6100 |
| Change (%) | -3.27% | -1.79% | -0.74% | - | +0.62% | +2.20% | +3.13% |
| Change | -0.1461 | -0.0798 | -0.0332 | - | +0.0277 | +0.0982 | +0.1398 |
| Level | Intermediate | Major | Major | - | Major | Intermediate | Major |
Attention could also be paid to pivot points to set price objectives:
| Pivot points | S3 | S2 | S1 | PP | R1 | R2 | R3 |
|---|---|---|---|---|---|---|---|
| Standard | 4.4003 | 4.4173 | 4.4464 | 4.4634 | 4.4925 | 4.5095 | 4.5386 |
| Camarilla | 4.4627 | 4.4670 | 4.4712 | 4.4754 | 4.4796 | 4.4839 | 4.4881 |
| Woodie | 4.4063 | 4.4203 | 4.4524 | 4.4664 | 4.4985 | 4.5125 | 4.5446 |
| Fibonacci | 4.4173 | 4.4349 | 4.4458 | 4.4634 | 4.4810 | 4.4919 | 4.5095 |
| Pivot points | S3 | S2 | S1 | PP | R1 | R2 | R3 |
|---|---|---|---|---|---|---|---|
| Standard | 4.4007 | 4.4160 | 4.4436 | 4.4589 | 4.4865 | 4.5018 | 4.5294 |
| Camarilla | 4.4594 | 4.4633 | 4.4673 | 4.4712 | 4.4751 | 4.4791 | 4.4830 |
| Woodie | 4.4069 | 4.4191 | 4.4498 | 4.4620 | 4.4927 | 4.5049 | 4.5356 |
| Fibonacci | 4.4160 | 4.4324 | 4.4425 | 4.4589 | 4.4753 | 4.4854 | 4.5018 |
| Pivot points | S3 | S2 | S1 | PP | R1 | R2 | R3 |
|---|---|---|---|---|---|---|---|
| Standard | 4.2725 | 4.3218 | 4.3841 | 4.4334 | 4.4957 | 4.5450 | 4.6073 |
| Camarilla | 4.4156 | 4.4258 | 4.4361 | 4.4463 | 4.4565 | 4.4668 | 4.4770 |
| Woodie | 4.2789 | 4.3251 | 4.3905 | 4.4367 | 4.5021 | 4.5483 | 4.6137 |
| Fibonacci | 4.3218 | 4.3645 | 4.3908 | 4.4334 | 4.4761 | 4.5024 | 4.5450 |
Numerical data
The following are the details of the technical indicators and moving averages that were collected to generate this technical analysis:
| RSI (14): | 51.75 | |
| MACD (12,26,9): | -0.0032 | |
| Directional Movement: | -3.6897 | |
| AROON (14): | 78.5714 | |
| DEMA (21): | 4.4507 | |
| Parabolic SAR (0,02-0,02-0,2): | 4.4818 | |
| Elder Ray (13): | 0.0113 | |
| Super Trend (3,10): | 4.4895 | |
| Zig ZAG (10): | 4.4700 | |
| VORTEX (21): | 1.1365 | |
| Stochastique (14,3,5): | 76.84 | |
| TEMA (21): | 4.4599 | |
| Williams %R (14): | -13.71 | |
| Chande Momentum Oscillator (20): | 0.0248 | |
| Repulse (5,40,3): | 0.4813 | |
| ROCnROLL: | 1 | |
| TRIX (15,9): | -0.0316 | |
| Courbe Coppock: | 0.75 |
| MA7: | 4.4609 | |
| MA20: | 4.4517 | |
| MA50: | 4.4888 | |
| MA100: | 4.4661 | |
| MAexp7: | 4.4612 | |
| MAexp20: | 4.4587 | |
| MAexp50: | 4.4686 | |
| MAexp100: | 4.4489 | |
| Price / MA7: | +0.21% | |
| Price / MA20: | +0.42% | |
| Price / MA50: | -0.41% | |
| Price / MA100: | +0.09% | |
| Price / MAexp7: | +0.20% | |
| Price / MAexp20: | +0.26% | |
| Price / MAexp50: | +0.04% | |
| Price / MAexp100: | +0.48% |
News
Don"t forget to follow the news on EUR/PLN. At the time of publication of this analysis, the latest news was as follows:
-
 Where Is EUR/PLN Heading?
-
Volatility Expected For EUR/PLN
-
Poland: Political risks, and the EUR/PLN range-break
About author

Online


Add a comment
Comments
0 comments on the analysis EUR/PLN - Daily