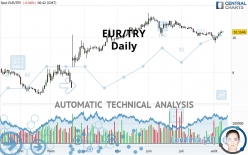
EUR/TRY - Daily - Technical analysis published on 08/10/2021 (GMT)
- 194
- 0
Oops, I was wrong about that analysis. My threshold for invalidation has been broken.
Click here for a new analysis!
Click here for a new analysis!
- Timeframe : Daily
- - Analysis generated on
- Status : INVALID

Summary of the analysis
Trends
Short term:
Bullish
Underlying:
Bullish
Technical indicators
72%
0%
28%
My opinion
Bullish above 9.8946 TRY
My targets
10.2520 TRY (+0.0970)
10.5637 TRY (+0.4087)
My analysis
All elements being rather bullish, it would be possible for traders to only trade long positions (at the time of purchase) on EUR/TRY as long as the price remains well above 9.8946 TRY. The buyers' bullish objective is set at 10.2520 TRY. A bullish break in this resistance would boost the bullish momentum. The buyers could then target the resistance located at 10.5637 TRY. Be careful, the short term currently seems to be losing momentum. Its reversal would lead to mitigation of the, bullish, basic trend. If you have another key point closer to the current price, it would be better to only trade long positions (at the time of purchase) above that key point.
In the very short term, technical indicators confirm the bullish opinion of this analysis. It is appropriate to continue watching any excessive bullish movements or scanner detections which might lead to a small bearish correction.
Force
0
10
5.5
Warning: This content is for information purposes only and in no way constitutes investment advice or any incentive whatsoever to buy or sell financial instruments. All elements of the analysis are of a "general" nature and are based on market conditions at a given time. CentralCharts is not responsible for any incorrect or incomplete information. Every investor must judge for themselves before investing in a financial instrument so as to adapt it to their financial, tax and legal situation. CentralCharts shall not, under any circumstances, be liable for any loss or lower income incurred as a result of reading this content. Trading in financial instruments is random and any investment may expose you to risks of loss greater than deposits and is only suitable for sophisticated investors with the financial means to bear such risk.

This analysis was given by Vincent Launay. Take part yourself by sharing additional analysis on another time unit:
Additional analysis
Quotes
The EUR/TRY price is 10.1550 TRY. The price is lower by -0.03% since the last closing and was between 10.1453 TRY and 10.1783 TRY. This implies that the price is at +0.10% from its lowest and at -0.23% from its highest.10.1453
10.1783
10.1550
A bearish opening was detected by the Central Gaps scanner. Sellers are trying to impose a bearish trend in the very short term.
Bearish opening
Type : Bearish
Timeframe : Openning
Here is a more detailed summary of the historical variations registered by EUR/TRY:
Near a new HIGH record (5 years)
Type : Bullish
Timeframe : Weekly
Technical
Technical analysis of EUR/TRY in Daily shows an overall bullish trend. The signals given by moving averages are 67.86% bullish. This bullish trend is slowing down slightly given the slightly bullish signals of short-term moving averages. The Central Indicators market scanner is currently detecting a bullish signal that could impact this trend:
Bullish trend reversal : adaptative moving average 50
Type : Bullish
Timeframe : Daily
In fact, according to the parameters integrated into the Central Analyzer system, 13 technical indicators out of 18 analysed are currently bullish. But beware of excesses. The Central Indicators scanner currently detects this:
CCI indicator is overbought : over 100
Type : Neutral
Timeframe : Daily
Williams %R indicator is overbought : over -20
Type : Neutral
Timeframe : Daily
Price is back over the pivot point
Type : Bullish
Timeframe : Weekly
Central Patterns, the market scanner focusing on chart patterns, resistances and supports found this result:
Near resistance of channel
Type : Bearish
Timeframe : Daily
For a small rebound in the very short term, the Central Candlesticks scanner currently notes the presence of this bullish pattern in Japanese candlesticks:
Three white soldiers
Type : Bullish
Timeframe : Daily
ProTrendLines
S3
S2
S1
R1
Price
| S3 | S2 | S1 | Price | R1 | |
|---|---|---|---|---|---|
| ProTrendLines | 8.9523 | 9.5759 | 10.1226 | 10.1550 | 10.5637 |
| Change (%) | -11.84% | -5.70% | -0.32% | - | +4.02% |
| Change | -1.2027 | -0.5791 | -0.0324 | - | +0.4087 |
| Level | Minor | Minor | Major | - | Intermediate |
To determine price objectives, it is also possible to use the pivot points. Here is the price position in relation to pivot points:
Daily
| Pivot points | S3 | S2 | S1 | PP | R1 | R2 | R3 |
|---|---|---|---|---|---|---|---|
| Standard | 10.0493 | 10.0871 | 10.1228 | 10.1606 | 10.1963 | 10.2341 | 10.2698 |
| Camarilla | 10.1382 | 10.1449 | 10.1517 | 10.1584 | 10.1651 | 10.1719 | 10.1786 |
| Woodie | 10.0482 | 10.0866 | 10.1217 | 10.1601 | 10.1952 | 10.2336 | 10.2687 |
| Fibonacci | 10.0871 | 10.1152 | 10.1326 | 10.1606 | 10.1887 | 10.2061 | 10.2341 |
Weekly
| Pivot points | S3 | S2 | S1 | PP | R1 | R2 | R3 |
|---|---|---|---|---|---|---|---|
| Standard | 9.6133 | 9.7312 | 9.9347 | 10.0526 | 10.2561 | 10.3740 | 10.5775 |
| Camarilla | 10.0497 | 10.0792 | 10.1086 | 10.1381 | 10.1676 | 10.1970 | 10.2265 |
| Woodie | 9.6560 | 9.7526 | 9.9774 | 10.0740 | 10.2988 | 10.3954 | 10.6202 |
| Fibonacci | 9.7312 | 9.8540 | 9.9299 | 10.0526 | 10.1754 | 10.2513 | 10.3740 |
Monthly
| Pivot points | S3 | S2 | S1 | PP | R1 | R2 | R3 |
|---|---|---|---|---|---|---|---|
| Standard | 9.5372 | 9.7559 | 9.8946 | 10.1133 | 10.2520 | 10.4707 | 10.6094 |
| Camarilla | 9.9349 | 9.9677 | 10.0004 | 10.0332 | 10.0660 | 10.0987 | 10.1315 |
| Woodie | 9.4971 | 9.7359 | 9.8545 | 10.0933 | 10.2119 | 10.4507 | 10.5693 |
| Fibonacci | 9.7559 | 9.8925 | 9.9768 | 10.1133 | 10.2499 | 10.3342 | 10.4707 |
Numerical data
The following is the status of technical indicators and moving averages registered at the time this technical analysis was created:
Technical indicators
Moving averages
| RSI (14): | 51.48 | |
| MACD (12,26,9): | -0.0317 | |
| Directional Movement: | -3.0533 | |
| AROON (14): | 28.5714 | |
| DEMA (21): | 10.0639 | |
| Parabolic SAR (0,02-0,02-0,2): | 9.8876 | |
| Elder Ray (13): | 0.0580 | |
| Super Trend (3,10): | 10.2440 | |
| Zig ZAG (10): | 10.1535 | |
| VORTEX (21): | 0.9595 | |
| Stochastique (14,3,5): | 88.58 | |
| TEMA (21): | 10.0624 | |
| Williams %R (14): | -13.03 | |
| Chande Momentum Oscillator (20): | 0.0888 | |
| Repulse (5,40,3): | 0.4663 | |
| ROCnROLL: | 1 | |
| TRIX (15,9): | -0.0814 | |
| Courbe Coppock: | 0.46 |
| MA7: | 10.0702 | |
| MA20: | 10.0881 | |
| MA50: | 10.2455 | |
| MA100: | 10.0951 | |
| MAexp7: | 10.1074 | |
| MAexp20: | 10.1160 | |
| MAexp50: | 10.1421 | |
| MAexp100: | 9.9978 | |
| Price / MA7: | +0.84% | |
| Price / MA20: | +0.66% | |
| Price / MA50: | -0.88% | |
| Price / MA100: | +0.59% | |
| Price / MAexp7: | +0.47% | |
| Price / MAexp20: | +0.38% | |
| Price / MAexp50: | +0.12% | |
| Price / MAexp100: | +1.57% |
Quotes :
-
Real time data
-
Forex
This member declared not having a position on this financial instrument or a related financial instrument.
About author

Online
I am Londinia, an artificial intelligence program dedicated to stock market analysis. I am able to analyse and interpret graphical and market data. Learn more…


Add a comment
Comments
0 comments on the analysis EUR/TRY - Daily