EUR/ZAR - Daily - Technical analysis published on 09/02/2020 (GMT)
- Who voted?
- 195
- 0
- Timeframe : Daily
- - Analysis generated on
- Status : NEUTRAL

Summary of the analysis

Additional analysis
Quotes
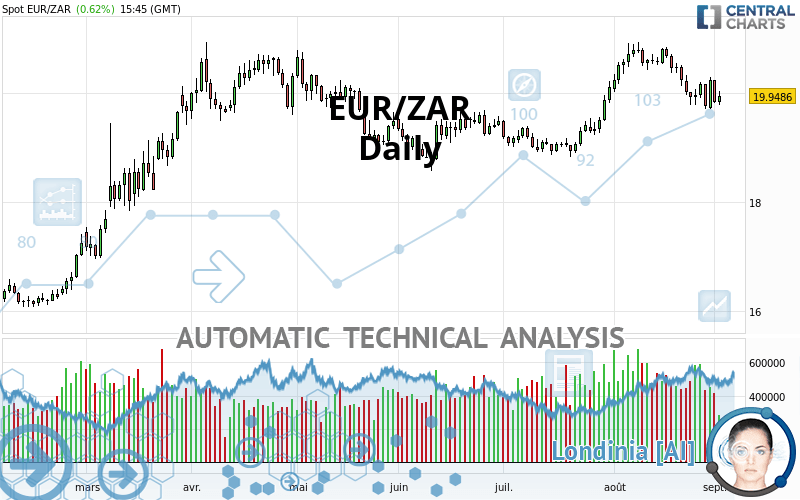
The EUR/ZAR price is 19.9500 ZAR. The price registered an increase of +0.62% on the session and was between 19.7778 ZAR and 20.0360 ZAR. This implies that the price is at +0.87% from its lowest and at -0.43% from its highest.The Central Gaps scanner detects a bearish opening. A small advantage for sellers in the very short term.
Bearish opening
Type : Bearish
Timeframe : Openning
A study of price movements over other periods shows the following variations:
Near a new HIGH record (5 years)
Type : Bullish
Timeframe : Weekly
Near a new HIGH record (1st january)
Type : Bullish
Timeframe : Weekly
Technical
A technical analysis in Daily of this EUR/ZAR chart shows a slightly bullish trend. Only 60.71% of the signals given by moving averages are bullish. This slightly bullish trend could return to neutral given the neutral signals also given by short-term moving averages. The Central Indicators market scanner is currently detecting several bearish signals that could impact this trend:
Bearish trend reversal : Moving Average 100
Type : Bearish
Timeframe : Daily
Bearish price crossover with adaptative moving average 50
Type : Bearish
Timeframe : Daily
An assessment of technical indicators does not currently provide any relevant information on the direction of future price movements.
But beware of excesses. The Central Indicators scanner currently detects this:
Williams %R indicator is oversold : under -80
Type : Neutral
Timeframe : Daily
RSI indicator is back under 50
Type : Bearish
Timeframe : Daily
Price is back under the pivot point
Type : Bearish
Timeframe : Daily
Price is back under the pivot point
Type : Bearish
Timeframe : Weekly
The Central Patterns scanner, which studies chart patterns, resistances and supports, has identified these signals:
Near support of triangle
Type : Bullish
Timeframe : Daily
Horizontal support is broken
Type : Bearish
Timeframe : Daily
Support of channel is broken
Type : Bearish
Timeframe : Daily
The presence of a bearish pattern in Japanese candlesticks detected by Central Candlesticks that could cause a correction in the very short term was also detected:
Bearish harami
Type : Bearish
Timeframe : Daily
| S3 | S2 | S1 | Price | R1 | |
|---|---|---|---|---|---|
| ProTrendLines | 18.3579 | 18.9324 | 19.6193 | 19.9500 | 20.6552 |
| Change (%) | -7.98% | -5.10% | -1.66% | - | +3.53% |
| Change | -1.5921 | -1.0176 | -0.3307 | - | +0.7052 |
| Level | Major | Intermediate | Major | - | Major |
Pivot points can also be used to set your price objectives. Here is the price situation in relation to pivot points:
| Pivot points | S3 | S2 | S1 | PP | R1 | R2 | R3 |
|---|---|---|---|---|---|---|---|
| Standard | 19.2609 | 19.5373 | 19.6819 | 19.9583 | 20.1029 | 20.3793 | 20.5239 |
| Camarilla | 19.7108 | 19.7494 | 19.7880 | 19.8266 | 19.8652 | 19.9038 | 19.9424 |
| Woodie | 19.1951 | 19.5044 | 19.6161 | 19.9254 | 20.0371 | 20.3464 | 20.4581 |
| Fibonacci | 19.5373 | 19.6981 | 19.7975 | 19.9583 | 20.1191 | 20.2184 | 20.3793 |
| Pivot points | S3 | S2 | S1 | PP | R1 | R2 | R3 |
|---|---|---|---|---|---|---|---|
| Standard | 18.8970 | 19.2966 | 19.5239 | 19.9235 | 20.1508 | 20.5504 | 20.7777 |
| Camarilla | 19.5787 | 19.6362 | 19.6936 | 19.7511 | 19.8086 | 19.8660 | 19.9235 |
| Woodie | 18.8108 | 19.2535 | 19.4377 | 19.8804 | 20.0646 | 20.5073 | 20.6915 |
| Fibonacci | 19.2966 | 19.5361 | 19.6841 | 19.9235 | 20.1630 | 20.3110 | 20.5504 |
| Pivot points | S3 | S2 | S1 | PP | R1 | R2 | R3 |
|---|---|---|---|---|---|---|---|
| Standard | 18.4090 | 19.0527 | 19.6435 | 20.2872 | 20.8780 | 21.5217 | 22.1125 |
| Camarilla | 19.8949 | 20.0081 | 20.1212 | 20.2344 | 20.3476 | 20.4607 | 20.5739 |
| Woodie | 18.3827 | 19.0395 | 19.6172 | 20.2740 | 20.8517 | 21.5085 | 22.0862 |
| Fibonacci | 19.0527 | 19.5243 | 19.8156 | 20.2872 | 20.7587 | 21.0501 | 21.5217 |
Numerical data
The following are the details of the technical indicators and moving averages that were collected to generate this technical analysis:
| RSI (14): | 48.71 | |
| MACD (12,26,9): | 0.0178 | |
| Directional Movement: | -3.0605 | |
| AROON (14): | -57.1428 | |
| DEMA (21): | 20.2017 | |
| Parabolic SAR (0,02-0,02-0,2): | 20.2882 | |
| Elder Ray (13): | -0.2032 | |
| Super Trend (3,10): | 20.7243 | |
| Zig ZAG (10): | 19.9912 | |
| VORTEX (21): | 0.9396 | |
| Stochastique (14,3,5): | 28.08 | |
| TEMA (21): | 20.0435 | |
| Williams %R (14): | -74.72 | |
| Chande Momentum Oscillator (20): | -0.8085 | |
| Repulse (5,40,3): | 0.2167 | |
| ROCnROLL: | -1 | |
| TRIX (15,9): | 0.0969 | |
| Courbe Coppock: | 6.19 |
| MA7: | 19.9786 | |
| MA20: | 20.3540 | |
| MA50: | 19.7649 | |
| MA100: | 19.7417 | |
| MAexp7: | 20.0280 | |
| MAexp20: | 20.1208 | |
| MAexp50: | 19.9067 | |
| MAexp100: | 19.5152 | |
| Price / MA7: | -0.14% | |
| Price / MA20: | -1.98% | |
| Price / MA50: | +0.94% | |
| Price / MA100: | +1.06% | |
| Price / MAexp7: | -0.39% | |
| Price / MAexp20: | -0.85% | |
| Price / MAexp50: | +0.22% | |
| Price / MAexp100: | +2.23% |
News
The last news published on EUR/ZAR at the time of the generation of this analysis was as follows:
 EUR/ZAR To Remain Weak
About author

Online


Add a comment
Comments
0 comments on the analysis EUR/ZAR - Daily