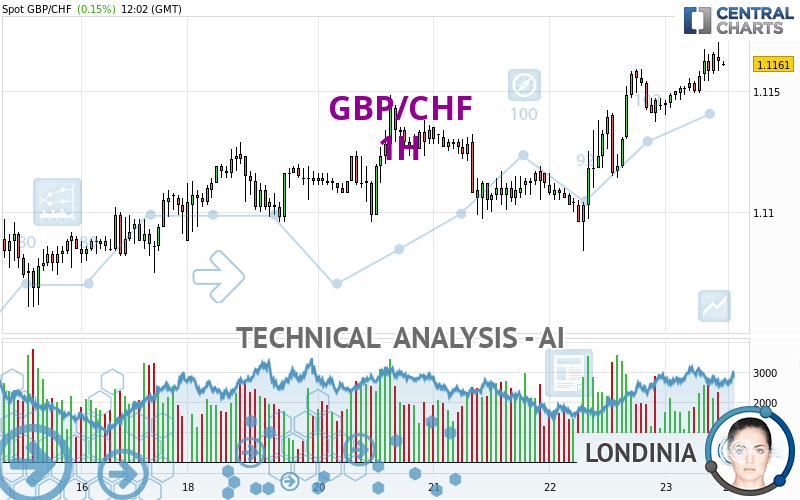
GBP/CHF - 1H - Technical analysis published on 02/23/2024 (GMT)
- 87
- 0
Click here for a new analysis!
- Timeframe : 1H
- - Analysis generated on
- Status : TARGET REACHED

Summary of the analysis

Additional analysis
Quotes
The GBP/CHF rating is 1.1161 CHF. On the day, this instrument gained +0.15% and was between 1.1140 CHF and 1.1170 CHF. This implies that the price is at +0.19% from its lowest and at -0.08% from its highest.Here is a more detailed summary of the historical variations registered by GBP/CHF:
Near a new LOW record (1 year)
Type : Bearish
Timeframe : Weekly
Near a new LOW record (1st january)
Type : Bearish
Timeframe : Weekly
Near a new LOW record (1 month)
Type : Bearish
Timeframe : Weekly
Technical
Technical analysis of this 1H chart of GBP/CHF indicates that the overall trend is strongly bullish. 92.86% of the signals given by moving averages are bullish. The overall trend is supported by the strong bullish signals from short-term moving averages. The Central Indicators market scanner currently does not detect any result that concerns moving averages.
The probability of a further increase is high given the direction of the technical indicators.
Caution: the Central Indicators scanner currently detects an excess:
CCI indicator is overbought : over 100
Type : Neutral
Timeframe : 1 hour
Previous candle closed over Bollinger bands
Type : Neutral
Timeframe : 1 hour
CCI indicator: bearish divergence
Type : Bearish
Timeframe : 1 hour
MACD indicator: bearish divergence
Type : Bearish
Timeframe : 1 hour
RSI indicator: bearish divergence
Type : Bearish
Timeframe : 1 hour
Price is back over the pivot point
Type : Bullish
Timeframe : Weekly
The Central Patterns scanner, which studies chart patterns, resistances and supports, has identified these signals:
Near horizontal resistance
Type : Bearish
Timeframe : 1 hour
Resistance of channel is broken
Type : Bullish
Timeframe : 1 hour
The presence of a bearish pattern in Japanese candlesticks detected by Central Candlesticks that could cause a correction in the very short term was also detected:
Bearish harami
Type : Bearish
Timeframe : 1 hour
| S3 | S2 | S1 | Price | R1 | R2 | R3 | |
|---|---|---|---|---|---|---|---|
| ProTrendLines | 1.1119 | 1.1148 | 1.1159 | 1.1161 | 1.1174 | 1.1185 | 1.1231 |
| Change (%) | -0.38% | -0.12% | -0.02% | - | +0.12% | +0.22% | +0.63% |
| Change | -0.0042 | -0.0013 | -0.0002 | - | +0.0013 | +0.0024 | +0.0070 |
| Level | Intermediate | Major | Minor | - | Major | Major | Minor |
Attention could also be paid to pivot points to set price objectives:
| Pivot points | S3 | S2 | S1 | PP | R1 | R2 | R3 |
|---|---|---|---|---|---|---|---|
| Standard | 1.1024 | 1.1054 | 1.1099 | 1.1129 | 1.1174 | 1.1204 | 1.1249 |
| Camarilla | 1.1123 | 1.1130 | 1.1137 | 1.1144 | 1.1151 | 1.1158 | 1.1165 |
| Woodie | 1.1032 | 1.1058 | 1.1107 | 1.1133 | 1.1182 | 1.1208 | 1.1257 |
| Fibonacci | 1.1054 | 1.1083 | 1.1100 | 1.1129 | 1.1158 | 1.1175 | 1.1204 |
| Pivot points | S3 | S2 | S1 | PP | R1 | R2 | R3 |
|---|---|---|---|---|---|---|---|
| Standard | 1.0870 | 1.0950 | 1.1025 | 1.1105 | 1.1180 | 1.1260 | 1.1335 |
| Camarilla | 1.1057 | 1.1072 | 1.1086 | 1.1100 | 1.1114 | 1.1128 | 1.1143 |
| Woodie | 1.0868 | 1.0949 | 1.1023 | 1.1104 | 1.1178 | 1.1259 | 1.1333 |
| Fibonacci | 1.0950 | 1.1009 | 1.1046 | 1.1105 | 1.1164 | 1.1201 | 1.1260 |
| Pivot points | S3 | S2 | S1 | PP | R1 | R2 | R3 |
|---|---|---|---|---|---|---|---|
| Standard | 1.0345 | 1.0514 | 1.0724 | 1.0893 | 1.1103 | 1.1272 | 1.1482 |
| Camarilla | 1.0831 | 1.0866 | 1.0900 | 1.0935 | 1.0970 | 1.1005 | 1.1039 |
| Woodie | 1.0367 | 1.0524 | 1.0746 | 1.0903 | 1.1125 | 1.1282 | 1.1504 |
| Fibonacci | 1.0514 | 1.0658 | 1.0748 | 1.0893 | 1.1037 | 1.1127 | 1.1272 |
Numerical data
The following is the status of the technical indicators and moving averages at the time of publication of this technical analysis:
| RSI (14): | 60.53 | |
| MACD (12,26,9): | 0.0009 | |
| Directional Movement: | 16.6643 | |
| AROON (14): | 92.8571 | |
| DEMA (21): | 1.1161 | |
| Parabolic SAR (0,02-0,02-0,2): | 1.1154 | |
| Elder Ray (13): | 0.0010 | |
| Super Trend (3,10): | 1.1136 | |
| Zig ZAG (10): | 1.1160 | |
| VORTEX (21): | 1.2299 | |
| Stochastique (14,3,5): | 79.70 | |
| TEMA (21): | 1.1164 | |
| Williams %R (14): | -24.24 | |
| Chande Momentum Oscillator (20): | 0.0018 | |
| Repulse (5,40,3): | 0.0290 | |
| ROCnROLL: | 1 | |
| TRIX (15,9): | 0.0117 | |
| Courbe Coppock: | 0.24 |
| MA7: | 1.1121 | |
| MA20: | 1.1045 | |
| MA50: | 1.0957 | |
| MA100: | 1.0992 | |
| MAexp7: | 1.1159 | |
| MAexp20: | 1.1149 | |
| MAexp50: | 1.1136 | |
| MAexp100: | 1.1125 | |
| Price / MA7: | +0.36% | |
| Price / MA20: | +1.05% | |
| Price / MA50: | +1.86% | |
| Price / MA100: | +1.54% | |
| Price / MAexp7: | +0.02% | |
| Price / MAexp20: | +0.11% | |
| Price / MAexp50: | +0.22% | |
| Price / MAexp100: | +0.32% |
News
Don't forget to follow the news on GBP/CHF. At the time of publication of this analysis, the latest news was as follows:
-
 GBP/CHF Forecast December 14, 2023
-
GBP/CHF Forecast December24, 2021
-
Weekly Technical Analysis: 23/07/2019 - USDJPY, GBPCHF, NZDUSD
-
GBP/CHF Is a Preferred Setup Because of its Lack of Key Events (Quick Take Video)
About author

Online


Add a comment
Comments
0 comments on the analysis GBP/CHF - 1H