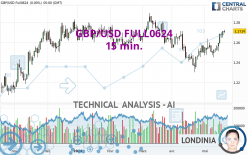
GBP/USD FULL0924 - 15 min. - Technical analysis published on 05/22/2024 (GMT)
- 93
- 0
- Timeframe : 15 min.
- - Analysis generated on
- Status : NEUTRAL

Summary of the analysis

Additional analysis
Quotes
GBP/USD FULL0624 rating 1.2713 USD. On the day, this instrument lost -0.01% with the lowest point at 1.2711 USD and the highest point at 1.2716 USD. The deviation from the price is +0.02% for the low point and -0.02% for the high point.A study of price movements over other periods shows the following variations:
Near a new HIGH record (1 year)
Type : Bullish
Timeframe : Weekly
Near a new LOW record (1st january)
Type : Bearish
Timeframe : Weekly
Near a new LOW record (1 month)
Type : Bearish
Timeframe : Weekly
Technical
Technical analysis of this 15 min. chart of GBP/USD FULL0624 indicates that the overall trend is slightly bullish. 50.00% of the signals given by moving averages are bullish. As the signals currently given by short-term moving averages are rather neutral, the slightly bullish trend could return to neutral. The Central Indicators scanner detects bullish and bearish signals on moving averages that could impact this trend:
Bearish price crossover with Moving Average 50
Type : Bearish
Timeframe : 15 minutes
Bearish price crossover with Moving Average 100
Type : Bearish
Timeframe : 15 minutes
Bearish price crossover with adaptative moving average 20
Type : Bearish
Timeframe : 15 minutes
Bullish price crossover with adaptative moving average 50
Type : Bullish
Timeframe : 15 minutes
An assessment of technical indicators does not currently provide any relevant information on the direction of future price movements.
Other results related to technical indicators were also found by the Central Indicators scanner:
RSI indicator is back under 50
Type : Bearish
Timeframe : 15 minutes
Williams %R indicator is back under -50
Type : Bearish
Timeframe : 15 minutes
Central Patterns, the scanner specializing in chart patterns, did not identify any signals.
For a small rebound in the very short term, the Central Candlesticks scanner currently notes the presence of these bullish patterns in Japanese candlesticks:
Bullish harami
Type : Bullish
Timeframe : 15 minutes
Bullish harami cross
Type : Bullish
Timeframe : 15 minutes
| S3 | S2 | S1 | Price | R1 | R2 | R3 | |
|---|---|---|---|---|---|---|---|
| ProTrendLines | 1.2647 | 1.2676 | 1.2712 | 1.2713 | 1.2806 | 1.2863 | 1.3150 |
| Change (%) | -0.52% | -0.29% | -0.01% | - | +0.73% | +1.18% | +3.44% |
| Change | -0.0066 | -0.0037 | -0.0001 | - | +0.0093 | +0.0150 | +0.0437 |
| Level | Minor | Intermediate | Intermediate | - | Minor | Major | Intermediate |
Attention could also be paid to pivot points to set price objectives:
| Pivot points | S3 | S2 | S1 | PP | R1 | R2 | R3 |
|---|---|---|---|---|---|---|---|
| Standard | 1.2651 | 1.2670 | 1.2691 | 1.2710 | 1.2731 | 1.2750 | 1.2771 |
| Camarilla | 1.2701 | 1.2705 | 1.2708 | 1.2712 | 1.2716 | 1.2719 | 1.2723 |
| Woodie | 1.2652 | 1.2671 | 1.2692 | 1.2711 | 1.2732 | 1.2751 | 1.2772 |
| Fibonacci | 1.2670 | 1.2685 | 1.2695 | 1.2710 | 1.2725 | 1.2735 | 1.2750 |
| Pivot points | S3 | S2 | S1 | PP | R1 | R2 | R3 |
|---|---|---|---|---|---|---|---|
| Standard | 1.2375 | 1.2443 | 1.2577 | 1.2645 | 1.2779 | 1.2847 | 1.2981 |
| Camarilla | 1.2656 | 1.2674 | 1.2693 | 1.2711 | 1.2730 | 1.2748 | 1.2767 |
| Woodie | 1.2408 | 1.2460 | 1.2610 | 1.2662 | 1.2812 | 1.2864 | 1.3014 |
| Fibonacci | 1.2443 | 1.2520 | 1.2568 | 1.2645 | 1.2722 | 1.2770 | 1.2847 |
| Pivot points | S3 | S2 | S1 | PP | R1 | R2 | R3 |
|---|---|---|---|---|---|---|---|
| Standard | 1.1918 | 1.2110 | 1.2330 | 1.2522 | 1.2742 | 1.2934 | 1.3154 |
| Camarilla | 1.2436 | 1.2474 | 1.2511 | 1.2549 | 1.2587 | 1.2625 | 1.2662 |
| Woodie | 1.1931 | 1.2117 | 1.2343 | 1.2529 | 1.2755 | 1.2941 | 1.3167 |
| Fibonacci | 1.2110 | 1.2268 | 1.2365 | 1.2522 | 1.2680 | 1.2777 | 1.2934 |
Numerical data
The following is the status of technical indicators and moving averages registered at the time this technical analysis was created:
| RSI (14): | 51.48 | |
| MACD (12,26,9): | 0.0000 | |
| Directional Movement: | -0.2449 | |
| AROON (14): | -28.5714 | |
| DEMA (21): | 1.2713 | |
| Parabolic SAR (0,02-0,02-0,2): | 1.2719 | |
| Elder Ray (13): | 0.0002 | |
| Super Trend (3,10): | 1.2722 | |
| Zig ZAG (10): | 1.2712 | |
| VORTEX (21): | 1.0690 | |
| Stochastique (14,3,5): | 42.13 | |
| TEMA (21): | 1.2713 | |
| Williams %R (14): | -50.00 | |
| Chande Momentum Oscillator (20): | 0.0001 | |
| Repulse (5,40,3): | -0.0266 | |
| ROCnROLL: | 2 | |
| TRIX (15,9): | -0.0002 | |
| Courbe Coppock: | 0.01 |
| MA7: | 1.2686 | |
| MA20: | 1.2587 | |
| MA50: | 1.2589 | |
| MA100: | 1.2639 | |
| MAexp7: | 1.2713 | |
| MAexp20: | 1.2713 | |
| MAexp50: | 1.2713 | |
| MAexp100: | 1.2712 | |
| Price / MA7: | +0.21% | |
| Price / MA20: | +1.00% | |
| Price / MA50: | +0.98% | |
| Price / MA100: | +0.59% | |
| Price / MAexp7: | -0% | |
| Price / MAexp20: | -0% | |
| Price / MAexp50: | -0% | |
| Price / MAexp100: | +0.01% |
About author

Online


Add a comment
Comments
0 comments on the analysis GBP/USD FULL0924 - 15 min.