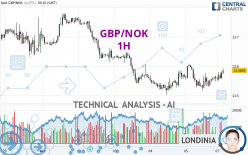
GBP/NOK - 1H - Technical analysis published on 04/08/2024 (GMT)
- 99
- 0
Click here for a new analysis!
- Timeframe : 1H
- - Analysis generated on
- Status : INVALID

Summary of the analysis

Additional analysis
Quotes
The GBP/NOK rating is 13.5855 NOK. On the day, this instrument gained +0.07% with the lowest point at 13.5752 NOK and the highest point at 13.5923 NOK. The deviation from the price is +0.08% for the low point and -0.05% for the high point.The Central Gaps scanner detects a bearish opening marking the presence of sellers ahead of buyers at the opening but not sufficiently marked to allow the price to register a quotation gap.
Bearish opening
Type : Bearish
Timeframe : Openning
So that you have an overall view of the price change, here is a table showing the variations over several periods:
Near a new HIGH record (5 years)
Type : Bullish
Timeframe : Weekly
Near a new HIGH record (1 year)
Type : Bullish
Timeframe : Weekly
Near a new LOW record (1st january)
Type : Bearish
Timeframe : Weekly
Near a new LOW record (1 month)
Type : Bearish
Timeframe : Weekly
Technical
Technical analysis of this 1H chart of GBP/NOK indicates that the overall trend is not clearly defined. The trend could quickly turn bullish due to the strong bullish signals currently being given by short-term moving averages. An assessment of moving averages reveals a bullish signal that could impact this trend:
Bullish price crossover with adaptative moving average 100
Type : Bullish
Timeframe : 1 hour
The probability of a further increase is high given the direction of the technical indicators.
Caution: the Central Indicators scanner currently detects an excess:
CCI indicator is overbought : over 100
Type : Neutral
Timeframe : 1 hour
Williams %R indicator is overbought : over -20
Type : Neutral
Timeframe : 1 hour
Pivot points : price is over resistance 1
Type : Neutral
Timeframe : 1 hour
Ichimoku : price is over the cloud
Type : Bullish
Timeframe : 1 hour
An analysis of the price chart with the Central Patterns scanner (detector of chart patterns and resistances and supports) shows several results that can have an impact on the price change:
Near horizontal resistance
Type : Bearish
Timeframe : 1 hour
Resistance of channel is broken
Type : Bullish
Timeframe : 1 hour
The Central Candlesticks scanner, specialised in Japanese candlesticks, did not identify any signals.
| S3 | S2 | S1 | Price | R1 | R2 | R3 | |
|---|---|---|---|---|---|---|---|
| ProTrendLines | 13.3235 | 13.5007 | 13.5529 | 13.5855 | 13.5896 | 13.6317 | 13.6688 |
| Change (%) | -1.93% | -0.62% | -0.24% | - | +0.03% | +0.34% | +0.61% |
| Change | -0.2620 | -0.0848 | -0.0326 | - | +0.0041 | +0.0462 | +0.0833 |
| Level | Major | Intermediate | Major | - | Intermediate | Intermediate | Minor |
Attention could also be paid to pivot points to set price objectives:
| Pivot points | S3 | S2 | S1 | PP | R1 | R2 | R3 |
|---|---|---|---|---|---|---|---|
| Standard | 13.5241 | 13.5369 | 13.5564 | 13.5692 | 13.5887 | 13.6015 | 13.6210 |
| Camarilla | 13.5670 | 13.5700 | 13.5729 | 13.5759 | 13.5789 | 13.5818 | 13.5848 |
| Woodie | 13.5275 | 13.5386 | 13.5598 | 13.5709 | 13.5921 | 13.6032 | 13.6244 |
| Fibonacci | 13.5369 | 13.5492 | 13.5569 | 13.5692 | 13.5815 | 13.5892 | 13.6015 |
| Pivot points | S3 | S2 | S1 | PP | R1 | R2 | R3 |
|---|---|---|---|---|---|---|---|
| Standard | 13.1700 | 13.3354 | 13.4504 | 13.6158 | 13.7308 | 13.8962 | 14.0112 |
| Camarilla | 13.4884 | 13.5141 | 13.5398 | 13.5655 | 13.5912 | 13.6169 | 13.6426 |
| Woodie | 13.1449 | 13.3228 | 13.4253 | 13.6032 | 13.7057 | 13.8836 | 13.9861 |
| Fibonacci | 13.3354 | 13.4425 | 13.5087 | 13.6158 | 13.7229 | 13.7891 | 13.8962 |
| Pivot points | S3 | S2 | S1 | PP | R1 | R2 | R3 |
|---|---|---|---|---|---|---|---|
| Standard | 12.9199 | 13.1050 | 13.3785 | 13.5636 | 13.8371 | 14.0222 | 14.2957 |
| Camarilla | 13.5260 | 13.5680 | 13.6101 | 13.6521 | 13.6941 | 13.7362 | 13.7782 |
| Woodie | 12.9642 | 13.1271 | 13.4228 | 13.5857 | 13.8814 | 14.0443 | 14.3400 |
| Fibonacci | 13.1050 | 13.2802 | 13.3884 | 13.5636 | 13.7388 | 13.8470 | 14.0222 |
Numerical data
The following is the status of technical indicators and moving averages registered at the time this technical analysis was created:
| RSI (14): | 59.45 | |
| MACD (12,26,9): | 0.0042 | |
| Directional Movement: | 8.6901 | |
| AROON (14): | 100.0000 | |
| DEMA (21): | 13.5654 | |
| Parabolic SAR (0,02-0,02-0,2): | 13.5326 | |
| Elder Ray (13): | 0.0193 | |
| Super Trend (3,10): | 13.5917 | |
| Zig ZAG (10): | 13.5893 | |
| VORTEX (21): | 0.9718 | |
| Stochastique (14,3,5): | 83.93 | |
| TEMA (21): | 13.5717 | |
| Williams %R (14): | -7.43 | |
| Chande Momentum Oscillator (20): | 0.0237 | |
| Repulse (5,40,3): | 0.1406 | |
| ROCnROLL: | 1 | |
| TRIX (15,9): | 0.0006 | |
| Courbe Coppock: | 0.34 |
| MA7: | 13.6055 | |
| MA20: | 13.5701 | |
| MA50: | 13.4348 | |
| MA100: | 13.3778 | |
| MAexp7: | 13.5685 | |
| MAexp20: | 13.5603 | |
| MAexp50: | 13.5656 | |
| MAexp100: | 13.5869 | |
| Price / MA7: | -0.15% | |
| Price / MA20: | +0.11% | |
| Price / MA50: | +1.12% | |
| Price / MA100: | +1.55% | |
| Price / MAexp7: | +0.13% | |
| Price / MAexp20: | +0.19% | |
| Price / MAexp50: | +0.15% | |
| Price / MAexp100: | -0.01% |
About author
Online


Add a comment
Comments
0 comments on the analysis GBP/NOK - 1H