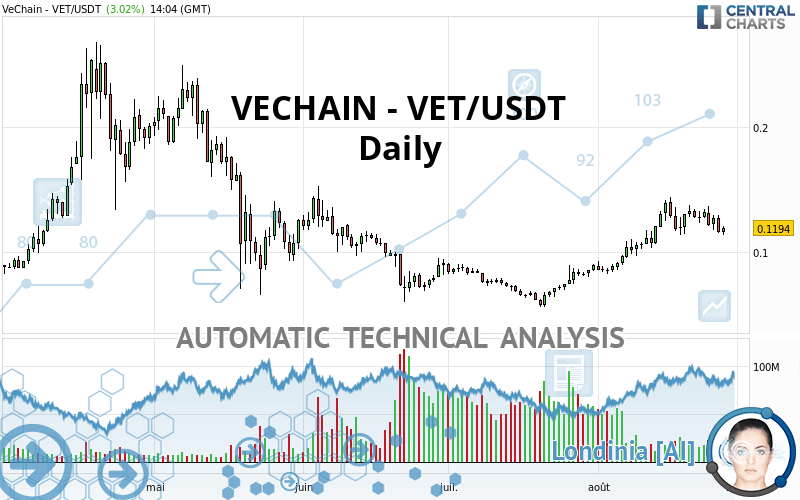
VECHAIN - VET/USDT - Daily - Technical analysis published on 08/27/2021 (GMT)
- 233
- 0
Click here for a new analysis!
- Timeframe : Daily
- - Analysis generated on
- Status : TARGET REACHED

Summary of the analysis

Additional analysis
Quotes
The VECHAIN - VET/USDT rating is 0.119500 USDT. The price registered an increase of +3.11% on the session and was between 0.113700 USDT and 0.120800 USDT. This implies that the price is at +5.10% from its lowest and at -1.08% from its highest.A bullish opening was detected by the Central Gaps scanner. Buyers are trying to impose a bullish momentum in the very short term.
Bullish opening
Type : Bullish
Timeframe : Openning
Here is a more detailed summary of the historical variations registered by VECHAIN - VET/USDT:
Technical
Technical analysis of VECHAIN - VET/USDT in Daily shows an overall bullish trend. 78.57% of the signals given by moving averages are bullish. This bullish trend shows slight signs of slowing down given the slightly bullish signals given by the short-term moving averages. The Central Indicators scanner detects bearish signals on moving averages that could impact this trend:
Bearish trend reversal : adaptative moving average 20
Type : Bearish
Timeframe : Daily
Bearish price crossover with Moving Average 20
Type : Bearish
Timeframe : Daily
Bearish price crossover with adaptative moving average 20
Type : Bearish
Timeframe : Daily
The probability of a further decline is low given the direction of the technical indicators.
Central Indicators, the scanner specialised in technical indicators, has identified these signals:
Price is back over the pivot point
Type : Bullish
Timeframe : Weekly
Price is back under the pivot point
Type : Bearish
Timeframe : Daily
Price is back under the pivot point
Type : Bearish
Timeframe : Weekly
Momentum indicator is back under 0
Type : Bearish
Timeframe : Daily
Williams %R indicator is back under -50
Type : Bearish
Timeframe : Daily
Central Patterns, the market scanner focusing on chart patterns, resistances and supports found this result:
Horizontal resistance is broken
Type : Bullish
Timeframe : Daily
The Central Candlesticks scanner, specialised in Japanese candlesticks, did not identify any signals.
| S3 | S2 | S1 | Price | R1 | R2 | R3 | |
|---|---|---|---|---|---|---|---|
| ProTrendLines | 0.057740 | 0.086220 | 0.118100 | 0.119500 | 0.139400 | 0.168100 | 0.188400 |
| Change (%) | -51.68% | -27.85% | -1.17% | - | +16.65% | +40.67% | +57.66% |
| Change | -0.061760 | -0.033280 | -0.001400 | - | +0.019900 | +0.048600 | +0.068900 |
| Level | Intermediate | Intermediate | Intermediate | - | Intermediate | Minor | Minor |
Attention could also be paid to pivot points to set price objectives:
| Pivot points | S3 | S2 | S1 | PP | R1 | R2 | R3 |
|---|---|---|---|---|---|---|---|
| Standard | 0.096900 | 0.106100 | 0.111000 | 0.120200 | 0.125100 | 0.134300 | 0.139200 |
| Camarilla | 0.112023 | 0.113315 | 0.114608 | 0.115900 | 0.117193 | 0.118485 | 0.119778 |
| Woodie | 0.094750 | 0.105025 | 0.108850 | 0.119125 | 0.122950 | 0.133225 | 0.137050 |
| Fibonacci | 0.106100 | 0.111486 | 0.114814 | 0.120200 | 0.125586 | 0.128914 | 0.134300 |
| Pivot points | S3 | S2 | S1 | PP | R1 | R2 | R3 |
|---|---|---|---|---|---|---|---|
| Standard | 0.082233 | 0.097767 | 0.112933 | 0.128467 | 0.143633 | 0.159167 | 0.174333 |
| Camarilla | 0.119658 | 0.122472 | 0.125286 | 0.128100 | 0.130914 | 0.133728 | 0.136543 |
| Woodie | 0.082050 | 0.097675 | 0.112750 | 0.128375 | 0.143450 | 0.159075 | 0.174150 |
| Fibonacci | 0.097767 | 0.109494 | 0.116739 | 0.128467 | 0.140194 | 0.147439 | 0.159167 |
| Pivot points | S3 | S2 | S1 | PP | R1 | R2 | R3 |
|---|---|---|---|---|---|---|---|
| Standard | 0.032653 | 0.044337 | 0.066863 | 0.078547 | 0.101073 | 0.112757 | 0.135283 |
| Camarilla | 0.079982 | 0.083118 | 0.086254 | 0.089390 | 0.092526 | 0.095662 | 0.098798 |
| Woodie | 0.038075 | 0.047048 | 0.072285 | 0.081258 | 0.106495 | 0.115468 | 0.140705 |
| Fibonacci | 0.044337 | 0.057405 | 0.065478 | 0.078547 | 0.091615 | 0.099688 | 0.112757 |
Numerical data
The following is the status of the technical indicators and moving averages at the time of publication of this technical analysis:
| RSI (14): | 52.59 | |
| MACD (12,26,9): | 0.0075 | |
| Directional Movement: | 2.837985 | |
| AROON (14): | 21.428572 | |
| DEMA (21): | 0.129134 | |
| Parabolic SAR (0,02-0,02-0,2): | 0.136148 | |
| Elder Ray (13): | -0.004417 | |
| Super Trend (3,10): | 0.102595 | |
| Zig ZAG (10): | 0.117700 | |
| VORTEX (21): | 1.0928 | |
| Stochastique (14,3,5): | 33.58 | |
| TEMA (21): | 0.129786 | |
| Williams %R (14): | -84.69 | |
| Chande Momentum Oscillator (20): | -0.021400 | |
| Repulse (5,40,3): | -7.9983 | |
| ROCnROLL: | -1 | |
| TRIX (15,9): | 1.5153 | |
| Courbe Coppock: | 19.47 |
| MA7: | 0.124443 | |
| MA20: | 0.121110 | |
| MA50: | 0.095011 | |
| MA100: | 0.098459 | |
| MAexp7: | 0.122579 | |
| MAexp20: | 0.117937 | |
| MAexp50: | 0.106636 | |
| MAexp100: | 0.104732 | |
| Price / MA7: | -3.97% | |
| Price / MA20: | -1.33% | |
| Price / MA50: | +25.77% | |
| Price / MA100: | +21.37% | |
| Price / MAexp7: | -2.51% | |
| Price / MAexp20: | +1.33% | |
| Price / MAexp50: | +12.06% | |
| Price / MAexp100: | +14.10% |
About author

Online


Add a comment
Comments
0 comments on the analysis VECHAIN - VET/USDT - Daily