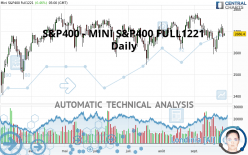
S&P400 - MINI S&P400 FULL1224 - Daily - Technical analysis published on 09/29/2021 (GMT)
- 186
- 0
Click here for a new analysis!
- Timeframe : Daily
- - Analysis generated on
- Status : TARGET REACHED

Summary of the analysis

Additional analysis
Quotes
S&P400 - MINI S&P400 FULL1221 rating 2,686.40 USD. The price registered an increase of +0.46% on the session and was between 2,676.20 USD and 2,691.70 USD. This implies that the price is at +0.38% from its lowest and at -0.20% from its highest.The Central Gaps scanner detects a bullish opening. A small advantage for buyers in the very short term.
Bullish opening
Type : Bullish
Timeframe : Openning
A study of price movements over other periods shows the following variations:
Near a new HIGH record (5 years)
Type : Bullish
Timeframe : Weekly
Near a new HIGH record (1st january)
Type : Bullish
Timeframe : Weekly
Technical
A technical analysis in Daily of this S&P400 - MINI S&P400 FULL1221 chart shows a neutral trend. The trend could quickly turn bearish due to the strong bearish signals currently being given by short-term moving averages. An assessment of moving averages reveals several bearish signals that could impact this trend:
Bearish trend reversal : adaptative moving average 20
Type : Bearish
Timeframe : Daily
Moving Average bearish crossovers : MA20 & MA50
Type : Bearish
Timeframe : Daily
Bearish price crossover with Moving Average 20
Type : Bearish
Timeframe : Daily
Bearish price crossover with Moving Average 50
Type : Bearish
Timeframe : Daily
Bearish price crossover with Moving Average 100
Type : Bearish
Timeframe : Daily
Bearish price crossover with adaptative moving average 20
Type : Bearish
Timeframe : Daily
Bearish price crossover with adaptative moving average 100
Type : Bearish
Timeframe : Daily
An assessment of technical indicators does not currently provide any relevant information to suggest whether the signal given by the technical indicators is more bullish or bearish.
But beware of excesses. The Central Indicators scanner currently detects this:
MACD indicator: bearish divergence
Type : Bearish
Timeframe : Daily
RSI indicator is back under 50
Type : Bearish
Timeframe : Daily
Price is back under the pivot point
Type : Bearish
Timeframe : Daily
Momentum indicator is back under 0
Type : Bearish
Timeframe : Daily
Central Patterns, the scanner specializing in chart patterns, did not identify any signals.
The Central Candlesticks scanner, specialised in Japanese candlesticks, did not identify any signals.
| S3 | S2 | S1 | Price | R1 | R2 | |
|---|---|---|---|---|---|---|
| ProTrendLines | 2,575.40 | 2,639.99 | 2,678.94 | 2,686.40 | 2,720.19 | 2,766.80 |
| Change (%) | -4.13% | -1.73% | -0.28% | - | +1.26% | +2.99% |
| Change | -111.00 | -46.41 | -7.46 | - | +33.79 | +80.40 |
| Level | Major | Major | Intermediate | - | Intermediate | Major |
Pivot points can also be used to set your price objectives. Here is the price situation in relation to pivot points:
| Pivot points | S3 | S2 | S1 | PP | R1 | R2 | R3 |
|---|---|---|---|---|---|---|---|
| Standard | 2,605.03 | 2,638.07 | 2,656.13 | 2,689.17 | 2,707.23 | 2,740.27 | 2,758.33 |
| Camarilla | 2,660.15 | 2,664.83 | 2,669.52 | 2,674.20 | 2,678.88 | 2,683.57 | 2,688.25 |
| Woodie | 2,597.55 | 2,634.33 | 2,648.65 | 2,685.43 | 2,699.75 | 2,736.53 | 2,750.85 |
| Fibonacci | 2,638.07 | 2,657.59 | 2,669.65 | 2,689.17 | 2,708.69 | 2,720.75 | 2,740.27 |
| Pivot points | S3 | S2 | S1 | PP | R1 | R2 | R3 |
|---|---|---|---|---|---|---|---|
| Standard | 2,501.13 | 2,547.07 | 2,618.93 | 2,664.87 | 2,736.73 | 2,782.67 | 2,854.53 |
| Camarilla | 2,658.41 | 2,669.20 | 2,680.00 | 2,690.80 | 2,701.60 | 2,712.40 | 2,723.20 |
| Woodie | 2,514.10 | 2,553.55 | 2,631.90 | 2,671.35 | 2,749.70 | 2,789.15 | 2,867.50 |
| Fibonacci | 2,547.07 | 2,592.07 | 2,619.87 | 2,664.87 | 2,709.87 | 2,737.67 | 2,782.67 |
| Pivot points | S3 | S2 | S1 | PP | R1 | R2 | R3 |
|---|---|---|---|---|---|---|---|
| Standard | 2,499.40 | 2,557.60 | 2,657.00 | 2,715.20 | 2,814.60 | 2,872.80 | 2,972.20 |
| Camarilla | 2,713.06 | 2,727.51 | 2,741.95 | 2,756.40 | 2,770.85 | 2,785.29 | 2,799.74 |
| Woodie | 2,520.00 | 2,567.90 | 2,677.60 | 2,725.50 | 2,835.20 | 2,883.10 | 2,992.80 |
| Fibonacci | 2,557.60 | 2,617.80 | 2,655.00 | 2,715.20 | 2,775.40 | 2,812.60 | 2,872.80 |
Numerical data
The following is the status of the technical indicators and moving averages at the time of publication of this technical analysis:
| RSI (14): | 49.02 | |
| MACD (12,26,9): | -8.0000 | |
| Directional Movement: | -4.85 | |
| AROON (14): | -50.00 | |
| DEMA (21): | 2,680.23 | |
| Parabolic SAR (0,02-0,02-0,2): | 2,608.15 | |
| Elder Ray (13): | -1.37 | |
| Super Trend (3,10): | 2,747.94 | |
| Zig ZAG (10): | 2,686.30 | |
| VORTEX (21): | 0.9200 | |
| Stochastique (14,3,5): | 70.24 | |
| TEMA (21): | 2,672.13 | |
| Williams %R (14): | -32.59 | |
| Chande Momentum Oscillator (20): | -16.20 | |
| Repulse (5,40,3): | -0.4200 | |
| ROCnROLL: | -1 | |
| TRIX (15,9): | -0.0500 | |
| Courbe Coppock: | 3.29 |
| MA7: | 2,677.14 | |
| MA20: | 2,695.95 | |
| MA50: | 2,700.67 | |
| MA100: | 2,695.98 | |
| MAexp7: | 2,682.93 | |
| MAexp20: | 2,690.13 | |
| MAexp50: | 2,695.21 | |
| MAexp100: | 2,675.04 | |
| Price / MA7: | +0.35% | |
| Price / MA20: | -0.35% | |
| Price / MA50: | -0.53% | |
| Price / MA100: | -0.36% | |
| Price / MAexp7: | +0.13% | |
| Price / MAexp20: | -0.14% | |
| Price / MAexp50: | -0.33% | |
| Price / MAexp100: | +0.42% |
About author

Online


Add a comment
Comments
0 comments on the analysis S&P400 - MINI S&P400 FULL1224 - Daily