30Y TBOND FULL0624 - Daily - Technical analysis published on 04/18/2021 (GMT)
- 193
- 0
Click here for a new analysis!
- Timeframe : Daily
- - Analysis generated on
- Status : TARGET REACHED

Summary of the analysis

Additional analysis
Quotes
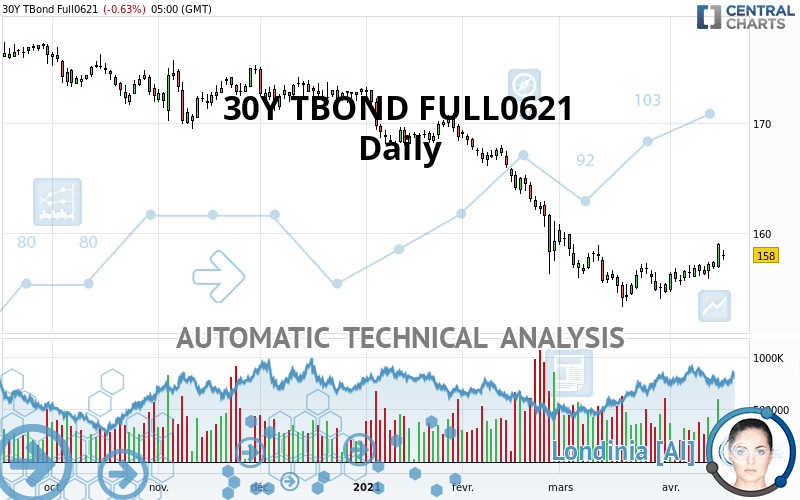
The 30Y TBOND FULL0621 rating is 158.00 USD. The price registered a decrease of -0.63% on the session and was traded between 157.50 USD and 158.47 USD over the period. The price is currently at +0.32% from its lowest and -0.30% from its highest.A bearish opening was detected by the Central Gaps scanner. Sellers are trying to impose a bearish trend in the very short term.
Bearish opening
Type : Bearish
Timeframe : Openning
So that you have an overall view of the price change, here is a table showing the variations over several periods:
Near a new LOW record (1st january)
Type : Bearish
Timeframe : Weekly
Technical
Technical analysis of this Daily chart of 30Y TBOND FULL0621 indicates that the overall trend is bearish. The signals given by moving averages are 71.43% bearish. This bearish trend could slow down given the neutral signals currently being given by short-term moving averages. The Central Indicators market scanner is currently detecting several bullish signals that could impact this trend:
Bullish price crossover with Moving Average 50
Type : Bullish
Timeframe : Daily
Bullish price crossover with adaptative moving average 100
Type : Bullish
Timeframe : Daily
Technical indicators are strongly bullish, suggesting that the price increase should continue.
But beware of excesses. The Central Indicators scanner currently detects this:
CCI indicator is overbought : over 100
Type : Neutral
Timeframe : Daily
CCI indicator: bullish divergence
Type : Bullish
Timeframe : Daily
MACD indicator: bullish divergence
Type : Bullish
Timeframe : Daily
RSI indicator: bullish divergence
Type : Bullish
Timeframe : Daily
Williams %R indicator is overbought : over -20
Type : Neutral
Timeframe : Daily
Pivot points : price is over resistance 2
Type : Neutral
Timeframe : Weekly
Pivot points : price is over resistance 3
Type : Neutral
Timeframe : Daily
Pivot points : price is under support 1
Type : Neutral
Timeframe : Weekly
Pivot points : price is under support 3
Type : Neutral
Timeframe : Daily
RSI indicator is back over 50
Type : Bullish
Timeframe : Daily
The analysis of the price chart with Central Patterns scanners does not return any result.
The Central Candlesticks scanner which studies Japanese candlesticks did not detect anything.
| S3 | S2 | S1 | Price | R1 | R2 | R3 | |
|---|---|---|---|---|---|---|---|
| ProTrendLines | 146.01 | 152.80 | 157.34 | 158.00 | 165.81 | 170.00 | 176.94 |
| Change (%) | -7.59% | -3.29% | -0.42% | - | +4.94% | +7.59% | +11.99% |
| Change | -11.99 | -5.20 | -0.66 | - | +7.81 | +12.00 | +18.94 |
| Level | Minor | Major | Major | - | Minor | Major | Major |
To determine price objectives, it is also possible to use the pivot points. Here is the price position in relation to pivot points:
| Pivot points | S3 | S2 | S1 | PP | R1 | R2 | R3 |
|---|---|---|---|---|---|---|---|
| Standard | 156.43 | 156.97 | 157.40 | 157.94 | 158.37 | 158.91 | 159.34 |
| Camarilla | 157.57 | 157.66 | 157.75 | 157.84 | 157.93 | 158.02 | 158.11 |
| Woodie | 156.39 | 156.94 | 157.36 | 157.91 | 158.33 | 158.88 | 159.30 |
| Fibonacci | 156.97 | 157.34 | 157.57 | 157.94 | 158.31 | 158.54 | 158.91 |
| Pivot points | S3 | S2 | S1 | PP | R1 | R2 | R3 |
|---|---|---|---|---|---|---|---|
| Standard | 152.82 | 154.30 | 156.07 | 157.55 | 159.32 | 160.80 | 162.57 |
| Camarilla | 156.95 | 157.24 | 157.54 | 157.84 | 158.14 | 158.44 | 158.73 |
| Woodie | 152.97 | 154.37 | 156.22 | 157.62 | 159.47 | 160.87 | 162.72 |
| Fibonacci | 154.30 | 155.54 | 156.31 | 157.55 | 158.79 | 159.56 | 160.80 |
| Pivot points | S3 | S2 | S1 | PP | R1 | R2 | R3 |
|---|---|---|---|---|---|---|---|
| Standard | 146.14 | 149.68 | 152.95 | 156.49 | 159.76 | 163.30 | 166.57 |
| Camarilla | 154.35 | 154.97 | 155.60 | 156.22 | 156.84 | 157.47 | 158.09 |
| Woodie | 146.01 | 149.61 | 152.82 | 156.42 | 159.63 | 163.23 | 166.44 |
| Fibonacci | 149.68 | 152.28 | 153.89 | 156.49 | 159.09 | 160.70 | 163.30 |
Numerical data
The following is the status of the technical indicators and moving averages at the time of publication of this technical analysis:
| RSI (14): | 53.29 | |
| MACD (12,26,9): | -0.1900 | |
| Directional Movement: | 5.38 | |
| AROON (14): | 85.72 | |
| DEMA (21): | 156.27 | |
| Parabolic SAR (0,02-0,02-0,2): | 154.83 | |
| Elder Ray (13): | 1.07 | |
| Super Trend (3,10): | 159.27 | |
| Zig ZAG (10): | 157.84 | |
| VORTEX (21): | 1.1200 | |
| Stochastique (14,3,5): | 86.76 | |
| TEMA (21): | 157.60 | |
| Williams %R (14): | -23.17 | |
| Chande Momentum Oscillator (20): | 3.25 | |
| Repulse (5,40,3): | 1.1300 | |
| ROCnROLL: | -1 | |
| TRIX (15,9): | -0.0700 | |
| Courbe Coppock: | 2.14 |
| MA7: | 157.21 | |
| MA20: | 156.31 | |
| MA50: | 158.79 | |
| MA100: | 164.91 | |
| MAexp7: | 157.35 | |
| MAexp20: | 156.89 | |
| MAexp50: | 159.18 | |
| MAexp100: | 163.27 | |
| Price / MA7: | +0.50% | |
| Price / MA20: | +1.08% | |
| Price / MA50: | -0.50% | |
| Price / MA100: | -4.19% | |
| Price / MAexp7: | +0.41% | |
| Price / MAexp20: | +0.71% | |
| Price / MAexp50: | -0.74% | |
| Price / MAexp100: | -3.23% |
About author

Online


Add a comment
Comments
0 comments on the analysis 30Y TBOND FULL0624 - Daily