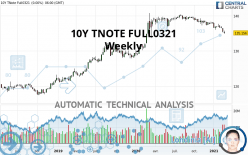
10Y TNOTE FULL0624 - Weekly - Technical analysis published on 02/25/2021 (GMT)
- 130
- 0
Click here for a new analysis!
- Timeframe : Weekly
- - Analysis generated on
- Status : TARGET REACHED

Summary of the analysis

Additional analysis
Quotes
10Y TNOTE FULL0321 rating 134.188 USD. The price registered a decrease of -1.28% over 5 days with the lowest point at 135.031 USD and the highest point at 135.594 USD. The deviation from the price is -0.62% for the low point and -1.04% for the high point.The Central Gaps scanner detects a bearish opening marking the presence of sellers ahead of buyers at the opening but not sufficiently marked to allow the price to register a quotation gap.
Bearish opening
Type : Bearish
Timeframe : Openning
A study of price movements over other periods shows the following variations:
Near a new HIGH record (5 years)
Type : Bullish
Timeframe : Weekly
Near a new HIGH record (1st january)
Type : Bullish
Timeframe : Weekly
Near a new HIGH record (1 month)
Type : Bullish
Timeframe : Weekly
The Central Volumes scanner notes the presence of abnormal volumes:
Abnormal volumes
Timeframe : 5 days
Technical
A technical analysis in Weekly of this 10Y TNOTE FULL0321 chart shows a neutral trend. The strong bearish signals currently being given by short-term moving averages could allow the overall trend to return to a bearish trend. The Central Indicators scanner detects a bearish signal on moving averages that could impact this trend:
Bearish trend reversal : Moving Average 50
Type : Bearish
Timeframe : Weekly
In fact, 14 technical indicators on 18 studied are currently positioned bearish. Caution: the Central Indicators scanner currently detects an excess:
RSI indicator is oversold : under 30
Type : Neutral
Timeframe : Weekly
CCI indicator is oversold : under -100
Type : Neutral
Timeframe : Weekly
Williams %R indicator is oversold : under -80
Type : Neutral
Timeframe : Weekly
Pivot points : price is under support 2
Type : Neutral
Timeframe : Weekly
Ichimoku : price is under the cloud
Type : Bearish
Timeframe : Weekly
No signals are given by Central Patterns, a market scanner specialised in chart patterns, resistances and supports.
The Central Candlesticks scanner, specialised in Japanese candlesticks, did not identify any signals.
| S3 | S2 | S1 | Price | R1 | R2 | |
|---|---|---|---|---|---|---|
| ProTrendLines | 121.234 | 127.925 | 133.863 | 134.188 | 137.094 | 140.328 |
| Change (%) | -9.65% | -4.67% | -0.24% | - | +2.17% | +4.58% |
| Change | -12.954 | -6.263 | -0.325 | - | +2.906 | +6.140 |
| Level | Minor | Major | Major | - | Minor | Major |
Attention could also be paid to pivot points to set price objectives:
| Pivot points | S3 | S2 | S1 | PP | R1 | R2 | R3 |
|---|---|---|---|---|---|---|---|
| Standard | 133.974 | 134.417 | 134.833 | 135.276 | 135.693 | 136.136 | 136.553 |
| Camarilla | 135.014 | 135.092 | 135.171 | 135.250 | 135.329 | 135.408 | 135.486 |
| Woodie | 133.961 | 134.410 | 134.820 | 135.270 | 135.680 | 136.129 | 136.539 |
| Fibonacci | 134.417 | 134.745 | 134.948 | 135.276 | 135.605 | 135.807 | 136.136 |
| Pivot points | S3 | S2 | S1 | PP | R1 | R2 | R3 |
|---|---|---|---|---|---|---|---|
| Standard | 133.890 | 134.609 | 135.031 | 135.750 | 136.172 | 136.891 | 137.313 |
| Camarilla | 135.139 | 135.244 | 135.348 | 135.453 | 135.558 | 135.662 | 135.767 |
| Woodie | 133.742 | 134.535 | 134.883 | 135.676 | 136.024 | 136.817 | 137.165 |
| Fibonacci | 134.609 | 135.045 | 135.314 | 135.750 | 136.186 | 136.455 | 136.891 |
| Pivot points | S3 | S2 | S1 | PP | R1 | R2 | R3 |
|---|---|---|---|---|---|---|---|
| Standard | 133.948 | 134.989 | 136.089 | 137.130 | 138.230 | 139.271 | 140.371 |
| Camarilla | 136.599 | 136.796 | 136.992 | 137.188 | 137.384 | 137.581 | 137.777 |
| Woodie | 133.977 | 135.004 | 136.118 | 137.145 | 138.259 | 139.286 | 140.400 |
| Fibonacci | 134.989 | 135.807 | 136.313 | 137.130 | 137.948 | 138.454 | 139.271 |
Numerical data
The following is the status of the technical indicators and moving averages at the time of publication of this technical analysis:
| RSI (14): | 26.22 | |
| MACD (12,26,9): | -0.6970 | |
| Directional Movement: | -29.016 | |
| AROON (14): | -100.000 | |
| DEMA (21): | 136.409 | |
| Parabolic SAR (0,02-0,02-0,2): | 137.151 | |
| Elder Ray (13): | -1.744 | |
| Super Trend (3,10): | 137.735 | |
| Zig ZAG (10): | 134.188 | |
| VORTEX (21): | 0.7330 | |
| Stochastique (14,3,5): | 7.91 | |
| TEMA (21): | 135.341 | |
| Williams %R (14): | -98.94 | |
| Chande Momentum Oscillator (20): | -3.188 | |
| Repulse (5,40,3): | -2.2630 | |
| ROCnROLL: | 2 | |
| TRIX (15,9): | -0.0400 | |
| Courbe Coppock: | 3.19 |
| MA7: | 135.344 | |
| MA20: | 136.281 | |
| MA50: | 136.907 | |
| MA100: | 137.608 | |
| MAexp7: | 135.996 | |
| MAexp20: | 137.114 | |
| MAexp50: | 136.695 | |
| MAexp100: | 134.024 | |
| Price / MA7: | -0.85% | |
| Price / MA20: | -1.54% | |
| Price / MA50: | -1.99% | |
| Price / MA100: | -2.49% | |
| Price / MAexp7: | -1.33% | |
| Price / MAexp20: | -2.13% | |
| Price / MAexp50: | -1.83% | |
| Price / MAexp100: | +0.12% |
About author

Online


Add a comment
Comments
0 comments on the analysis 10Y TNOTE FULL0624 - Weekly