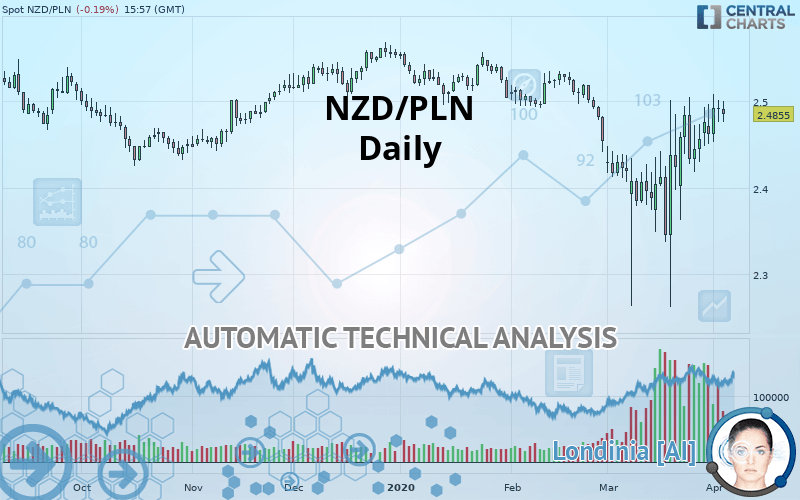
NZD/PLN - Daily - Technical analysis published on 04/03/2020 (GMT)
- Who voted?
- 244
- 0
Click here for a new analysis!
- Timeframe : Daily
- - Analysis generated on
- Status : TARGET REACHED

Summary of the analysis

Additional analysis
Quotes
The NZD/PLN rating is 2.4855 PLN. The price has increased by -0.19% since the last closing with the lowest point at 2.4754 PLN and the highest point at 2.5004 PLN. The deviation from the price is +0.41% for the low point and -0.60% for the high point.The Central Gaps scanner detects a bullish opening. A small advantage for buyers in the very short term.
Bullish opening
Type : Bullish
Timeframe : Openning
A study of price movements over other periods shows the following variations:
Near a new HIGH record (1st january)
Type : Bullish
Timeframe : Weekly
Near a new HIGH record (1 month)
Type : Bullish
Timeframe : Weekly
The Central Volumes scanner notes the presence of abnormal volumes:
Abnormal volumes
Timeframe : 5 days
Abnormal volumes
Timeframe : 20 days
Abnormal volumes
Timeframe : 50 days
Technical
Technical analysis of this Daily chart of NZD/PLN indicates that the overall trend is slightly bullish. 60.71% of the signals given by moving averages are bullish. The overall trend could accelerate as strong bullish signals from short-term moving averages are expected. The Central Indicators scanner detects bullish and bearish signals on moving averages that could impact this trend:
Bullish trend reversal : Moving Average 100
Type : Bullish
Timeframe : Daily
Bearish price crossover with adaptative moving average 100
Type : Bearish
Timeframe : Daily
Technical indicators are strongly bullish, suggesting that the price increase should continue.
Caution: the Central Indicators scanner currently detects an excess:
CCI indicator is overbought : over 100
Type : Neutral
Timeframe : Daily
CCI indicator: bearish divergence
Type : Bearish
Timeframe : Daily
Williams %R indicator is overbought : over -20
Type : Neutral
Timeframe : Daily
Price is back over the pivot point
Type : Bullish
Timeframe : Weekly
The Central Patterns scanner, which studies chart patterns, resistances and supports, has identified this signal:
Resistance of channel is broken
Type : Bullish
Timeframe : Daily
The Central Candlesticks scanner, specialised in Japanese candlesticks, did not identify any signals.
| S3 | S2 | S1 | Price | R1 | R2 | R3 | |
|---|---|---|---|---|---|---|---|
| ProTrendLines | 2.3846 | 2.4083 | 2.4322 | 2.4855 | 2.4873 | 2.5088 | 2.5305 |
| Change (%) | -4.06% | -3.11% | -2.14% | - | +0.07% | +0.94% | +1.81% |
| Change | -0.1009 | -0.0772 | -0.0533 | - | +0.0018 | +0.0233 | +0.0450 |
| Level | Minor | Major | Major | - | Intermediate | Intermediate | Intermediate |
Pivot points can also be used to set your price objectives. Here is the price situation in relation to pivot points:
| Pivot points | S3 | S2 | S1 | PP | R1 | R2 | R3 |
|---|---|---|---|---|---|---|---|
| Standard | 2.4505 | 2.4629 | 2.4766 | 2.4890 | 2.5027 | 2.5151 | 2.5288 |
| Camarilla | 2.4830 | 2.4854 | 2.4878 | 2.4902 | 2.4926 | 2.4950 | 2.4974 |
| Woodie | 2.4511 | 2.4632 | 2.4772 | 2.4893 | 2.5033 | 2.5154 | 2.5294 |
| Fibonacci | 2.4629 | 2.4729 | 2.4791 | 2.4890 | 2.4990 | 2.5052 | 2.5151 |
| Pivot points | S3 | S2 | S1 | PP | R1 | R2 | R3 |
|---|---|---|---|---|---|---|---|
| Standard | 2.2365 | 2.2998 | 2.3779 | 2.4412 | 2.5193 | 2.5826 | 2.6607 |
| Camarilla | 2.4172 | 2.4302 | 2.4431 | 2.4561 | 2.4691 | 2.4820 | 2.4950 |
| Woodie | 2.2440 | 2.3035 | 2.3854 | 2.4449 | 2.5268 | 2.5863 | 2.6682 |
| Fibonacci | 2.2998 | 2.3538 | 2.3872 | 2.4412 | 2.4952 | 2.5286 | 2.5826 |
| Pivot points | S3 | S2 | S1 | PP | R1 | R2 | R3 |
|---|---|---|---|---|---|---|---|
| Standard | 2.0730 | 2.1677 | 2.3149 | 2.4096 | 2.5568 | 2.6515 | 2.7987 |
| Camarilla | 2.3955 | 2.4177 | 2.4398 | 2.4620 | 2.4842 | 2.5064 | 2.5285 |
| Woodie | 2.0992 | 2.1808 | 2.3411 | 2.4227 | 2.5830 | 2.6646 | 2.8249 |
| Fibonacci | 2.1677 | 2.2601 | 2.3172 | 2.4096 | 2.5020 | 2.5591 | 2.6515 |
Numerical data
The following are the details of the technical indicators and moving averages that were collected to generate this technical analysis:
| RSI (14): | 55.84 | |
| MACD (12,26,9): | 0.0066 | |
| Directional Movement: | -4.3640 | |
| AROON (14): | 64.2857 | |
| DEMA (21): | 2.4579 | |
| Parabolic SAR (0,02-0,02-0,2): | 2.3031 | |
| Elder Ray (13): | 0.0269 | |
| Super Trend (3,10): | 2.3229 | |
| Zig ZAG (10): | 2.4866 | |
| VORTEX (21): | 1.0446 | |
| Stochastique (14,3,5): | 92.76 | |
| TEMA (21): | 2.4787 | |
| Williams %R (14): | -7.75 | |
| Chande Momentum Oscillator (20): | 0.1440 | |
| Repulse (5,40,3): | 0.7100 | |
| ROCnROLL: | 1 | |
| TRIX (15,9): | -0.0311 | |
| Courbe Coppock: | 6.20 |
| MA7: | 2.4728 | |
| MA20: | 2.4344 | |
| MA50: | 2.4717 | |
| MA100: | 2.4989 | |
| MAexp7: | 2.4746 | |
| MAexp20: | 2.4557 | |
| MAexp50: | 2.4668 | |
| MAexp100: | 2.4825 | |
| Price / MA7: | +0.51% | |
| Price / MA20: | +2.10% | |
| Price / MA50: | +0.56% | |
| Price / MA100: | -0.54% | |
| Price / MAexp7: | +0.44% | |
| Price / MAexp20: | +1.21% | |
| Price / MAexp50: | +0.76% | |
| Price / MAexp100: | +0.12% |
About author

Online


Add a comment
Comments
0 comments on the analysis NZD/PLN - Daily