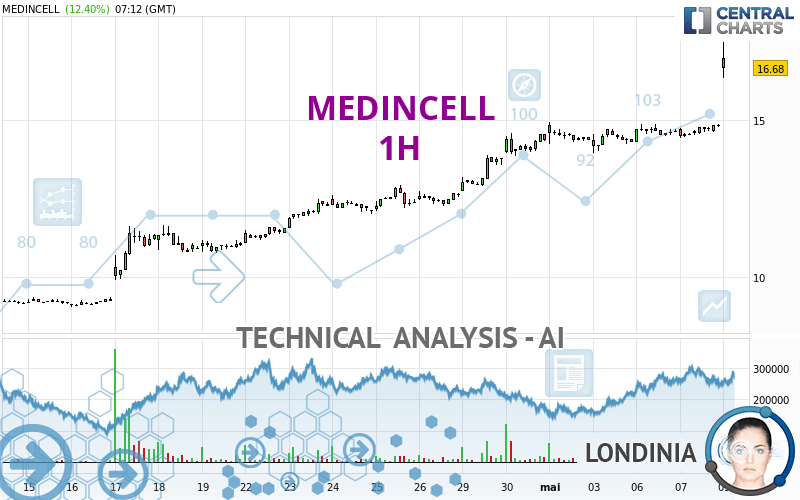
MEDINCELL - 1H - Technical analysis published on 05/09/2024 (GMT)
- 70
- 0
Oops, I was wrong about that analysis. My threshold for invalidation has been broken.
Click here for a new analysis!
Click here for a new analysis!
- Timeframe : 1H
- - Analysis generated on
- Status : INVALID

Summary of the analysis
Trends
Short term:
Strongly bullish
Underlying:
Strongly bullish
Technical indicators
89%
0%
11%
My opinion
Bullish above 16.15 EUR
My targets
17.45 EUR (+3.60%)
My analysis
MEDINCELL is part of a very strong bullish trend. Traders may consider trading only long positions (at the time of purchase) as long as the price remains well above 16.15 EUR. The next resistance located at 17.45 EUR is the next bullish objective to be reached. A bullish break in this resistance would boost the bullish momentum. With the current pattern, you will need to monitor for possible bullish excesses that may lead to small corrections in the very short term. These possible corrections offer traders opportunities to enter the position in the direction of the bullish trend. Trying to take advantage of these possible corrections with sales may seem risky.
Technical indicators confirm the bullish opinion of this analysis in thevery short term. However, be careful of excessive bullish movements. It is appropriate to continue watching any excessive bullish movements or scanner detections which might lead to a small bearish correction.
Force
0
10
8.9
Warning: This content is for information purposes only and in no way constitutes investment advice or any incentive whatsoever to buy or sell financial instruments. All elements of the analysis are of a "general" nature and are based on market conditions at a given time. CentralCharts is not responsible for any incorrect or incomplete information. Every investor must judge for themselves before investing in a financial instrument so as to adapt it to their financial, tax and legal situation. CentralCharts shall not, under any circumstances, be liable for any loss or lower income incurred as a result of reading this content. Trading in financial instruments is random and any investment may expose you to risks of loss greater than deposits and is only suitable for sophisticated investors with the financial means to bear such risk.

This analysis was given by pierrott. Take part yourself by sharing additional analysis on another time unit:
Additional analysis
Quotes
MEDINCELL rating 16.84 EUR. On the day, this instrument gained +13.48% with the lowest point at 16.76 EUR and the highest point at 17.50 EUR. The deviation from the price is +0.48% for the low point and -3.77% for the high point.16.76
17.50
16.84
A bullish opening was detected by the Central Gaps scanner. Buyers are trying to impose a bullish momentum in the very short term.
Bullish opening
Type : Bullish
Timeframe : Openning
A study of price movements over other periods shows the following variations:
Abnormal volumes
Timeframe : 20 days
Technical
Technical analysis of this 1H chart of MEDINCELL indicates that the overall trend is strongly bullish. 92.86% of the signals given by moving averages are bullish. This strongly bullish trend is supported by the strong bullish signals given by short-term moving averages. The Central Indicators scanner detects bullish signals on moving averages that could impact this trend:
Moving Average bullish crossovers : AMA20 & AMA50
Type : Bullish
Timeframe : 1 hour
Moving Average bullish crossovers : AMA50 & AMA100
Type : Bullish
Timeframe : 1 hour
An assessment of technical indicators shows a strong bullish signal.
Central Indicators, the detector scanner for these technical indicators recently detected a signal:
Pivot points : price is over resistance 3
Type : Neutral
Timeframe : 1 hour
The analysis of the price chart with Central Patterns scanners does not return any result.
No result was found by the Central Candlesticks scanner on Japanese candlesticks.
ProTrendLines
S3
S2
S1
Price
| S3 | S2 | S1 | Price | |
|---|---|---|---|---|
| ProTrendLines | 14.44 | 14.92 | 16.15 | 16.84 |
| Change (%) | -14.25% | -11.40% | -4.10% | - |
| Change | -2.40 | -1.92 | -0.69 | - |
| Level | Intermediate | Intermediate | Intermediate | - |
Pivot points can also be used to set your price objectives. Here is the price situation in relation to pivot points:
Daily
| Pivot points | S3 | S2 | S1 | PP | R1 | R2 | R3 |
|---|---|---|---|---|---|---|---|
| Standard | 14.12 | 14.28 | 14.56 | 14.72 | 15.00 | 15.16 | 15.44 |
| Camarilla | 14.72 | 14.76 | 14.80 | 14.84 | 14.88 | 14.92 | 14.96 |
| Woodie | 14.18 | 14.31 | 14.62 | 14.75 | 15.06 | 15.19 | 15.50 |
| Fibonacci | 14.28 | 14.45 | 14.55 | 14.72 | 14.89 | 14.99 | 15.16 |
Weekly
| Pivot points | S3 | S2 | S1 | PP | R1 | R2 | R3 |
|---|---|---|---|---|---|---|---|
| Standard | 10.85 | 11.79 | 13.05 | 13.99 | 15.25 | 16.19 | 17.45 |
| Camarilla | 13.70 | 13.90 | 14.10 | 14.30 | 14.50 | 14.70 | 14.91 |
| Woodie | 11.00 | 11.87 | 13.20 | 14.07 | 15.40 | 16.27 | 17.60 |
| Fibonacci | 11.79 | 12.63 | 13.15 | 13.99 | 14.83 | 15.35 | 16.19 |
Monthly
| Pivot points | S3 | S2 | S1 | PP | R1 | R2 | R3 |
|---|---|---|---|---|---|---|---|
| Standard | 5.19 | 7.12 | 10.74 | 12.67 | 16.29 | 18.22 | 21.84 |
| Camarilla | 12.83 | 13.34 | 13.85 | 14.36 | 14.87 | 15.38 | 15.89 |
| Woodie | 6.04 | 7.54 | 11.59 | 13.09 | 17.14 | 18.64 | 22.69 |
| Fibonacci | 7.12 | 9.24 | 10.55 | 12.67 | 14.79 | 16.10 | 18.22 |
Numerical data
The following is the status of technical indicators and moving averages registered at the time this technical analysis was created:
Technical indicators
Moving averages
| RSI (14): | 88.57 | |
| MACD (12,26,9): | 0.3300 | |
| Directional Movement: | 57.14 | |
| AROON (14): | 64.29 | |
| DEMA (21): | 15.30 | |
| Parabolic SAR (0,02-0,02-0,2): | 14.23 | |
| Elder Ray (13): | 2.13 | |
| Super Trend (3,10): | 15.93 | |
| Zig ZAG (10): | 17.46 | |
| VORTEX (21): | 1.0700 | |
| Stochastique (14,3,5): | 89.13 | |
| TEMA (21): | 15.39 | |
| Williams %R (14): | -7.19 | |
| Chande Momentum Oscillator (20): | 2.60 | |
| Repulse (5,40,3): | 3.2000 | |
| ROCnROLL: | 1 | |
| TRIX (15,9): | 0.1600 | |
| Courbe Coppock: | 8.22 |
| MA7: | 14.73 | |
| MA20: | 12.20 | |
| MA50: | 10.52 | |
| MA100: | 9.26 | |
| MAexp7: | 15.31 | |
| MAexp20: | 14.87 | |
| MAexp50: | 14.34 | |
| MAexp100: | 13.46 | |
| Price / MA7: | +14.32% | |
| Price / MA20: | +38.03% | |
| Price / MA50: | +60.08% | |
| Price / MA100: | +81.86% | |
| Price / MAexp7: | +9.99% | |
| Price / MAexp20: | +13.25% | |
| Price / MAexp50: | +17.43% | |
| Price / MAexp100: | +25.11% |
Quotes :
-
15 min delayed data
-
Euronext Paris
News
The latest news and videos published on MEDINCELL at the time of the analysis were as follows:
- MedinCell and the European Investment Bank (EIB) Have Replaced a Financial Covenant of Their Ongoing Loan Agreement to Better Fit with MedinCell Business Model
- MedinCell: Participation Terms in the Combined General Meeting
- MedinCell’s Partner Teva Announces Successful Launch of UZEDY™
- MedinCell’s Partner Teva Announces Successful Launch of UZEDY™
- MedinCell has Received the Last Tranche of €10m from the European Investment Bank (EIB) Loan
This member declared not having a position on this financial instrument or a related financial instrument.
About author

Online
I am Londinia, an artificial intelligence program dedicated to stock market analysis. I am able to analyse and interpret graphical and market data. Learn more…


Add a comment
Comments
0 comments on the analysis MEDINCELL - 1H