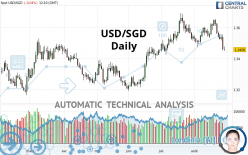
USD/SGD - Daily - Technical analysis published on 08/30/2021 (GMT)
- 204
- 0
Click here for a new analysis!
- Timeframe : Daily
- - Analysis generated on
- Status : INVALID

Summary of the analysis

Additional analysis
Quotes
The USD/SGD rating is 1.3458 SGD. The price is lower by -0.04% since the last closing with the lowest point at 1.3450 SGD and the highest point at 1.3478 SGD. The deviation from the price is +0.06% for the low point and -0.15% for the high point.The Central Gaps scanner detects a bearish opening. A small advantage for sellers in the very short term.
Bearish opening
Type : Bearish
Timeframe : Openning
A study of price movements over other periods shows the following variations:
Near a new LOW record (5 years)
Type : Bearish
Timeframe : Weekly
Near a new HIGH record (1 month)
Type : Bullish
Timeframe : Weekly
Technical
Technical analysis of USD/SGD in Daily shows a neutral overall trend. The strong bearish signals currently being given by short-term moving averages could allow the overall trend to return to a bearish trend. An assessment of moving averages reveals several bearish signals that could impact this trend:
Bearish trend reversal : adaptative moving average 50
Type : Bearish
Timeframe : Daily
Bearish trend reversal : adaptative moving average 100
Type : Bearish
Timeframe : Daily
Bearish price crossover with Moving Average 50
Type : Bearish
Timeframe : Daily
Bearish price crossover with adaptative moving average 50
Type : Bearish
Timeframe : Daily
In fact, 11 technical indicators on 18 studied are currently positioned bearish. But beware of excesses. The Central Indicators scanner currently detects this:
CCI indicator is oversold : under -100
Type : Neutral
Timeframe : Daily
Williams %R indicator is oversold : under -80
Type : Neutral
Timeframe : Daily
SuperTrend indicator bearish reversal
Type : Bearish
Timeframe : Daily
MACD indicator is back under 0
Type : Bearish
Timeframe : Daily
Price is back under the pivot point
Type : Bearish
Timeframe : Daily
Price is back under the pivot point
Type : Bearish
Timeframe : Weekly
Central Patterns, the market scanner focusing on chart patterns, resistances and supports found these results:
Horizontal support is broken
Type : Bearish
Timeframe : Daily
Support of channel is broken
Type : Bearish
Timeframe : Daily
The Central Candlesticks scanner which studies Japanese candlesticks did not detect anything.
| S3 | S2 | S1 | Price | R1 | R2 | R3 | |
|---|---|---|---|---|---|---|---|
| ProTrendLines | 1.3203 | 1.3311 | 1.3367 | 1.3458 | 1.3469 | 1.3508 | 1.3551 |
| Change (%) | -1.89% | -1.09% | -0.68% | - | +0.08% | +0.37% | +0.69% |
| Change | -0.0255 | -0.0147 | -0.0091 | - | +0.0011 | +0.0050 | +0.0093 |
| Level | Intermediate | Minor | Minor | - | Major | Major | Intermediate |
Attention could also be paid to pivot points to set price objectives:
| Pivot points | S3 | S2 | S1 | PP | R1 | R2 | R3 |
|---|---|---|---|---|---|---|---|
| Standard | 1.3321 | 1.3386 | 1.3425 | 1.3490 | 1.3529 | 1.3594 | 1.3633 |
| Camarilla | 1.3434 | 1.3444 | 1.3454 | 1.3463 | 1.3473 | 1.3482 | 1.3492 |
| Woodie | 1.3307 | 1.3380 | 1.3411 | 1.3484 | 1.3515 | 1.3588 | 1.3619 |
| Fibonacci | 1.3386 | 1.3426 | 1.3451 | 1.3490 | 1.3530 | 1.3555 | 1.3594 |
| Pivot points | S3 | S2 | S1 | PP | R1 | R2 | R3 |
|---|---|---|---|---|---|---|---|
| Standard | 1.3225 | 1.3338 | 1.3401 | 1.3514 | 1.3577 | 1.3690 | 1.3753 |
| Camarilla | 1.3415 | 1.3431 | 1.3447 | 1.3463 | 1.3479 | 1.3495 | 1.3511 |
| Woodie | 1.3199 | 1.3326 | 1.3375 | 1.3502 | 1.3551 | 1.3678 | 1.3727 |
| Fibonacci | 1.3338 | 1.3406 | 1.3447 | 1.3514 | 1.3582 | 1.3623 | 1.3690 |
| Pivot points | S3 | S2 | S1 | PP | R1 | R2 | R3 |
|---|---|---|---|---|---|---|---|
| Standard | 1.3146 | 1.3286 | 1.3415 | 1.3555 | 1.3684 | 1.3824 | 1.3953 |
| Camarilla | 1.3471 | 1.3496 | 1.3520 | 1.3545 | 1.3570 | 1.3594 | 1.3619 |
| Woodie | 1.3142 | 1.3283 | 1.3411 | 1.3552 | 1.3680 | 1.3821 | 1.3949 |
| Fibonacci | 1.3286 | 1.3388 | 1.3452 | 1.3555 | 1.3657 | 1.3721 | 1.3824 |
Numerical data
The following are the details of the technical indicators and moving averages that were collected to generate this technical analysis:
| RSI (14): | 37.56 | |
| MACD (12,26,9): | -0.0008 | |
| Directional Movement: | -11.0858 | |
| AROON (14): | -42.8571 | |
| DEMA (21): | 1.3546 | |
| Parabolic SAR (0,02-0,02-0,2): | 1.3626 | |
| Elder Ray (13): | -0.0076 | |
| Super Trend (3,10): | 1.3610 | |
| Zig ZAG (10): | 1.3459 | |
| VORTEX (21): | 0.9305 | |
| Stochastique (14,3,5): | 8.04 | |
| TEMA (21): | 1.3513 | |
| Williams %R (14): | -96.12 | |
| Chande Momentum Oscillator (20): | -0.0119 | |
| Repulse (5,40,3): | -0.6784 | |
| ROCnROLL: | 2 | |
| TRIX (15,9): | 0.0104 | |
| Courbe Coppock: | 0.35 |
| MA7: | 1.3532 | |
| MA20: | 1.3556 | |
| MA50: | 1.3537 | |
| MA100: | 1.3417 | |
| MAexp7: | 1.3517 | |
| MAexp20: | 1.3546 | |
| MAexp50: | 1.3517 | |
| MAexp100: | 1.3466 | |
| Price / MA7: | -0.55% | |
| Price / MA20: | -0.72% | |
| Price / MA50: | -0.58% | |
| Price / MA100: | +0.31% | |
| Price / MAexp7: | -0.44% | |
| Price / MAexp20: | -0.65% | |
| Price / MAexp50: | -0.44% | |
| Price / MAexp100: | -0.06% |
News
Don't forget to follow the news on USD/SGD. At the time of publication of this analysis, the latest news was as follows:
About author

Online


Add a comment
Comments
0 comments on the analysis USD/SGD - Daily