DOW JONES INDUSTRIAL AVERAGE - DJIA Posted Another All-Time High at 21,330 - Bullish Bias - 06/14/2017 (GMT)
- Who voted?
- 764
- 0
- Timeframe : Daily

DOW JONES INDUSTRIAL AVERAGE Chart
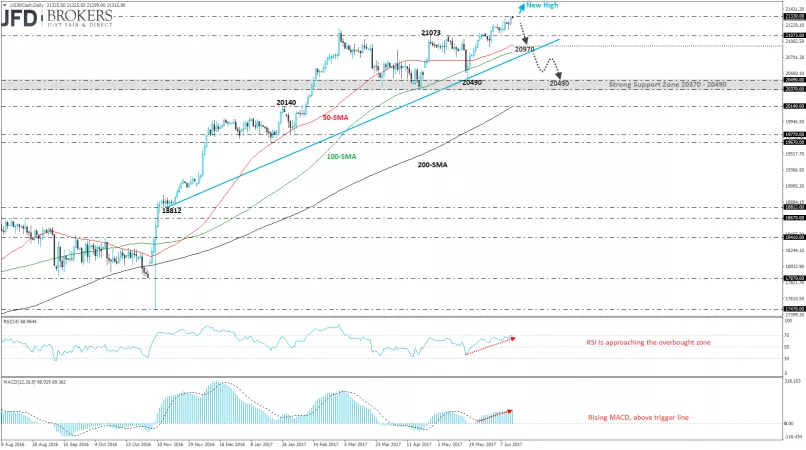
The Dow Jones Industrial Average gained significant ground and rose sharply to a new high at 21,330, as suggested in our previous analysis (see technical analysis here: http://bit.ly/2rZxbZZ) and added more than 1% at its value so far this month. The blue chip index continues developing above the daily ascending trend line which is standing since November 2016 as well above the three simple moving averages (50, 100 and 200).
Our expectation is a further bullish run above the 21,330 to record new all-time highs. On the other hand, we may see a correction until the uptrend line near 20,970 which overlaps with the 50-daily SMA. This is a less probable scenario, but in such case, if the index slip below 50 and 100 SMAs and the rising trend line, the next levels to watch are in the support area between 20,370 and 20,490. The MACD is rising above both, its trigger and zero lines while RSI is rising as well but it slowed slightly down. However, both are endorsing our bullish scenario.
Our expectation is a further bullish run above the 21,330 to record new all-time highs. On the other hand, we may see a correction until the uptrend line near 20,970 which overlaps with the 50-daily SMA. This is a less probable scenario, but in such case, if the index slip below 50 and 100 SMAs and the rising trend line, the next levels to watch are in the support area between 20,370 and 20,490. The MACD is rising above both, its trigger and zero lines while RSI is rising as well but it slowed slightly down. However, both are endorsing our bullish scenario.
This member did not declare if he had a position on this financial instrument or a related financial instrument.
About author

Offline


Add a comment
Comments
0 comments on the analysis DOW JONES INDUSTRIAL AVERAGE - Daily