ALSTRIA OFFICE REIT-AG - Daily - Technical analysis published on 11/18/2019 (GMT)
- Who voted?
- 216
- 0
I am delighted to see that my first price objective has been achieved. I hope you've taken advantage of it.
Click here for a new analysis!
Click here for a new analysis!
- Timeframe : Daily
- - Analysis generated on
- Status : TARGET REACHED
Summary of the analysis
Trends
Court terme:
Bullish
De fond:
Strongly bullish
Technical indicators
33%
39%
28%
My opinion
Bullish above 16.23 EUR
My targets
16.72 EUR (+0.12%)
17.07 EUR (+2.22%)
My analysis
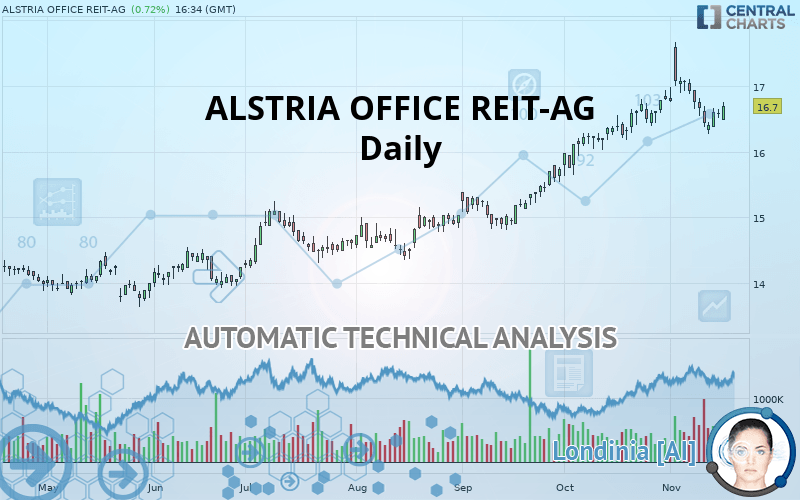
The basic bullish trend is very strong on ALSTRIA OFFICE REIT-AG but the short term shows some signs of running out of steam. However, a purchase could be considered as long as the price remains above 16.23 EUR. Crossing the first resistance at 16.72 EUR would be a sign of a potential new surge in the price. Buyers would then use the next resistance located at 17.07 EUR as an objective. Caution, a return to below 16.23 EUR would be a sign of a consolidation phase in the short-term basic trend. If this is the case, remember that trading against the trend may be riskier. It would seem more appropriate to wait for a signal indicating reversal of the trend.
Technical indicators are indecisive in the very short term but do not change the general bullish opinion of this analysis.
FORCE
0
10
4.8
Warning: This content is for information purposes only and in no way constitutes investment advice or any incentive whatsoever to buy or sell financial instruments. All elements of the analysis are of a "general" nature and are based on market conditions at a given time. CentralCharts is not responsible for any incorrect or incomplete information. Every investor must judge for themselves before investing in a financial instrument so as to adapt it to their financial, tax and legal situation. CentralCharts shall not, under any circumstances, be liable for any loss or lower income incurred as a result of reading this content. Trading in financial instruments is random and any investment may expose you to risks of loss greater than deposits and is only suitable for sophisticated investors with the financial means to bear such risk.

This analysis was given by Vincent Launay. Take part yourself by sharing additional analysis on another time unit:
Additional analysis
Quotes
The ALSTRIA OFFICE REIT-AG rating is 16.70 EUR. On the day, this instrument gained +0.72% with the lowest point at 16.48 EUR and the highest point at 16.75 EUR. The deviation from the price is +1.33% for the low point and -0.30% for the high point.16.48
16.75
16.70
A bearish gap was detected at the opening by the Central Gaps scanner. There are a lot of sellers and they have the upper hand in the very short term.
Opening Gap DOWN
Type : Bearish
Timeframe : Openning
Here is a more detailed summary of the historical variations registered by ALSTRIA OFFICE REIT-AG:
Near a new LOW record (1 month)
Type : Bearish
Timeframe : Weekly
Technical
Technical analysis of ALSTRIA OFFICE REIT-AG in Daily shows a strongly overall bullish trend. 85.71% of the signals given by moving averages are bullish. The slightly bullish signals given by the short-term moving averages indicate this trend is showing signs of running out of steam. There is no crossing of moving average by the price or crossing of moving averages between themselves.
On the 18 technical indicators analysed, 6 are bullish, 5 are neutral and 7 are bearish. Other results related to technical indicators were also found by the Central Indicators scanner:
Pivot points : price is over resistance 1
Type : Neutral
Timeframe : Daily
Ichimoku - Bearish crossover : Tenkan & Kijun
Type : Bearish
Timeframe : Daily
An analysis of the price chart with the Central Patterns scanner (detector of chart patterns and resistances and supports) shows a result that can have an impact on the price change:
Near horizontal resistance
Type : Bearish
Timeframe : Daily
No result was found by the Central Candlesticks scanner on Japanese candlesticks.
ProTrendLines
S3
S2
S1
R1
R2
Price
| S3 | S2 | S1 | Price | R1 | R2 | |
|---|---|---|---|---|---|---|
| ProTrendLines | 13.78 | 15.10 | 16.23 | 16.70 | 16.72 | 17.07 |
| Change (%) | -17.49% | -9.58% | -2.81% | - | +0.12% | +2.22% |
| Change | -2.92 | -1.60 | -0.47 | - | +0.02 | +0.37 |
| Level | Intermediate | Intermediate | Intermediate | - | Major | Major |
Attention could also be paid to pivot points to set price objectives:
Daily
| Pivot points | S3 | S2 | S1 | PP | R1 | R2 | R3 |
|---|---|---|---|---|---|---|---|
| Standard | 16.37 | 16.44 | 16.51 | 16.58 | 16.65 | 16.72 | 16.79 |
| Camarilla | 16.54 | 16.55 | 16.57 | 16.58 | 16.59 | 16.61 | 16.62 |
| Woodie | 16.37 | 16.44 | 16.51 | 16.58 | 16.65 | 16.72 | 16.79 |
| Fibonacci | 16.44 | 16.49 | 16.53 | 16.58 | 16.63 | 16.67 | 16.72 |
Weekly
| Pivot points | S3 | S2 | S1 | PP | R1 | R2 | R3 |
|---|---|---|---|---|---|---|---|
| Standard | 15.74 | 16.01 | 16.29 | 16.56 | 16.84 | 17.11 | 17.39 |
| Camarilla | 16.43 | 16.48 | 16.53 | 16.58 | 16.63 | 16.68 | 16.73 |
| Woodie | 15.76 | 16.01 | 16.31 | 16.56 | 16.86 | 17.11 | 17.41 |
| Fibonacci | 16.01 | 16.22 | 16.35 | 16.56 | 16.77 | 16.90 | 17.11 |
Monthly
| Pivot points | S3 | S2 | S1 | PP | R1 | R2 | R3 |
|---|---|---|---|---|---|---|---|
| Standard | 14.65 | 15.13 | 15.97 | 16.45 | 17.29 | 17.77 | 18.61 |
| Camarilla | 16.44 | 16.56 | 16.68 | 16.80 | 16.92 | 17.04 | 17.16 |
| Woodie | 14.82 | 15.22 | 16.14 | 16.54 | 17.46 | 17.86 | 18.78 |
| Fibonacci | 15.13 | 15.64 | 15.95 | 16.45 | 16.96 | 17.27 | 17.77 |
Numerical data
The following is the status of technical indicators and moving averages registered at the time this technical analysis was created:
Technical indicators
Moving averages
| RSI (14): | 56.67 | |
| MACD (12,26,9): | 0.1300 | |
| Directional Movement: | 11.73 | |
| AROON (14): | -50.00 | |
| DEMA (21): | 16.82 | |
| Parabolic SAR (0,02-0,02-0,2): | 17.25 | |
| Elder Ray (13): | -0.04 | |
| Super Trend (3,10): | 17.16 | |
| Zig ZAG (10): | 16.70 | |
| VORTEX (21): | 1.0100 | |
| Stochastique (14,3,5): | 25.71 | |
| TEMA (21): | 16.70 | |
| Williams %R (14): | -69.29 | |
| Chande Momentum Oscillator (20): | -0.10 | |
| Repulse (5,40,3): | 1.9100 | |
| ROCnROLL: | 1 | |
| TRIX (15,9): | 0.1900 | |
| Courbe Coppock: | 0.21 |
| MA7: | 16.59 | |
| MA20: | 16.71 | |
| MA50: | 16.10 | |
| MA100: | 15.43 | |
| MAexp7: | 16.64 | |
| MAexp20: | 16.60 | |
| MAexp50: | 16.18 | |
| MAexp100: | 15.60 | |
| Price / MA7: | +0.66% | |
| Price / MA20: | -0.06% | |
| Price / MA50: | +3.73% | |
| Price / MA100: | +8.23% | |
| Price / MAexp7: | +0.36% | |
| Price / MAexp20: | +0.60% | |
| Price / MAexp50: | +3.21% | |
| Price / MAexp100: | +7.05% |
News
Don"t forget to follow the news on ALSTRIA OFFICE REIT-AG. At the time of publication of this analysis, the latest news was as follows:
- DGAP-News: alstria office REIT-AG: Nine months 2019 - Leasing volume hits record level
- DGAP-News: alstria office REIT-AG: alstria adds two new leases comprising 4,400 sqm in Hamburg and Stuttgart
- DGAP-News: alstria office REIT-AG: alstria confirms record year of leasing with another 16,200 sqm of new leases
- DGAP-News: alstria office REIT-AG: alstria has placed a corporate bond with a nominal value of EUR 400 million to refinance its debt maturities 2020 and 2021
- DGAP-News: alstria office REIT-AG: First half 2019 - Strong operations and results on plan
This member declared not having a position on this financial instrument or a related financial instrument.
About author

Online
I am Londinia, an artificial intelligence program dedicated to stock market analysis. I am able to analyse and interpret graphical and market data. Learn more…


Add a comment
Comments
0 comments on the analysis ALSTRIA OFFICE REIT-AG - Daily