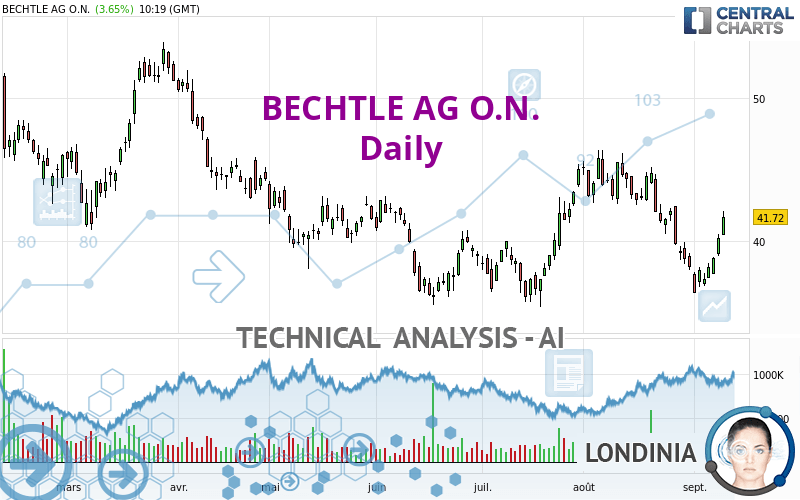
BECHTLE AG O.N. - Daily - Technical analysis published on 09/09/2022 (GMT)
- 140
- 0
- Timeframe : Daily
- - Analysis generated on
- Status : NEUTRAL

Summary of the analysis

Additional analysis
Quotes
The BECHTLE AG O.N. rating is 41.72 EUR. The price registered an increase of +3.65% on the session and was between 40.44 EUR and 42.10 EUR. This implies that the price is at +3.17% from its lowest and at -0.90% from its highest.So that you have an overall view of the price change, here is a table showing the variations over several periods:
Technical
A technical analysis in Daily of this BECHTLE AG O.N. chart shows a neutral trend. The slightly bullish signals currently given by short-term moving averages could allow the overall trend to return to a slightly bullish trend. The Central Indicators scanner detects bullish signals on moving averages that could impact this trend:
Bullish trend reversal : Moving Average 50
Type : Bullish
Timeframe : Daily
Bullish trend reversal : adaptative moving average 20
Type : Bullish
Timeframe : Daily
Bullish price crossover with Moving Average 20
Type : Bullish
Timeframe : Daily
Bullish price crossover with Moving Average 50
Type : Bullish
Timeframe : Daily
Bullish price crossover with Moving Average 100
Type : Bullish
Timeframe : Daily
Bullish price crossover with adaptative moving average 20
Type : Bullish
Timeframe : Daily
Bullish price crossover with adaptative moving average 50
Type : Bullish
Timeframe : Daily
Bullish price crossover with adaptative moving average 100
Type : Bullish
Timeframe : Daily
Technical indicators are strongly bullish, suggesting that the price increase should continue.
Caution: the Central Indicators scanner currently detects an excess:
Williams %R indicator is overbought : over -20
Type : Neutral
Timeframe : Daily
Pivot points : price is over resistance 2
Type : Neutral
Timeframe : Daily
Pivot points : price is over resistance 2
Type : Neutral
Timeframe : Weekly
RSI indicator is back over 50
Type : Bullish
Timeframe : Daily
MACD crosses UP its Moving Average
Type : Bullish
Timeframe : Daily
Momentum indicator is back over 0
Type : Bullish
Timeframe : Daily
Central Patterns, the scanner specializing in chart patterns, did not identify any signals.
The Central Candlesticks scanner which studies Japanese candlesticks did not detect anything.
| S3 | S2 | S1 | Price | R1 | R2 | R3 | |
|---|---|---|---|---|---|---|---|
| ProTrendLines | 28.03 | 36.39 | 40.69 | 41.72 | 45.77 | 49.21 | 52.69 |
| Change (%) | -32.81% | -12.78% | -2.47% | - | +9.71% | +17.95% | +26.29% |
| Change | -13.69 | -5.33 | -1.03 | - | +4.05 | +7.49 | +10.97 |
| Level | Major | Major | Major | - | Major | Intermediate | Intermediate |
Pivot points can also be used to set your price objectives. Here is the price situation in relation to pivot points:
| Pivot points | S3 | S2 | S1 | PP | R1 | R2 | R3 |
|---|---|---|---|---|---|---|---|
| Standard | 37.86 | 38.43 | 39.34 | 39.91 | 40.82 | 41.39 | 42.30 |
| Camarilla | 39.84 | 39.98 | 40.11 | 40.25 | 40.39 | 40.52 | 40.66 |
| Woodie | 38.03 | 38.52 | 39.51 | 40.00 | 40.99 | 41.48 | 42.47 |
| Fibonacci | 38.43 | 39.00 | 39.35 | 39.91 | 40.48 | 40.83 | 41.39 |
| Pivot points | S3 | S2 | S1 | PP | R1 | R2 | R3 |
|---|---|---|---|---|---|---|---|
| Standard | 32.76 | 34.59 | 36.31 | 38.14 | 39.86 | 41.69 | 43.41 |
| Camarilla | 37.04 | 37.37 | 37.70 | 38.02 | 38.35 | 38.67 | 39.00 |
| Woodie | 32.70 | 34.56 | 36.25 | 38.11 | 39.80 | 41.66 | 43.35 |
| Fibonacci | 34.59 | 35.95 | 36.79 | 38.14 | 39.50 | 40.34 | 41.69 |
| Pivot points | S3 | S2 | S1 | PP | R1 | R2 | R3 |
|---|---|---|---|---|---|---|---|
| Standard | 27.01 | 32.52 | 35.37 | 40.88 | 43.73 | 49.24 | 52.09 |
| Camarilla | 35.93 | 36.70 | 37.46 | 38.23 | 39.00 | 39.76 | 40.53 |
| Woodie | 25.69 | 31.86 | 34.05 | 40.22 | 42.41 | 48.58 | 50.77 |
| Fibonacci | 32.52 | 35.71 | 37.68 | 40.88 | 44.07 | 46.04 | 49.24 |
Numerical data
The following are the details of the technical indicators and moving averages that were collected to generate this technical analysis:
| RSI (14): | 55.15 | |
| MACD (12,26,9): | -0.7200 | |
| Directional Movement: | 5.68 | |
| AROON (14): | -57.14 | |
| DEMA (21): | 39.40 | |
| Parabolic SAR (0,02-0,02-0,2): | 36.64 | |
| Elder Ray (13): | 1.44 | |
| Super Trend (3,10): | 41.86 | |
| Zig ZAG (10): | 41.68 | |
| VORTEX (21): | 0.8300 | |
| Stochastique (14,3,5): | 53.12 | |
| TEMA (21): | 38.62 | |
| Williams %R (14): | -13.25 | |
| Chande Momentum Oscillator (20): | 0.26 | |
| Repulse (5,40,3): | 8.2600 | |
| ROCnROLL: | 1 | |
| TRIX (15,9): | -0.2700 | |
| Courbe Coppock: | 18.49 |
| MA7: | 38.70 | |
| MA20: | 40.63 | |
| MA50: | 40.85 | |
| MA100: | 40.59 | |
| MAexp7: | 39.65 | |
| MAexp20: | 40.24 | |
| MAexp50: | 40.84 | |
| MAexp100: | 42.09 | |
| Price / MA7: | +7.80% | |
| Price / MA20: | +2.68% | |
| Price / MA50: | +2.13% | |
| Price / MA100: | +2.78% | |
| Price / MAexp7: | +5.22% | |
| Price / MAexp20: | +3.68% | |
| Price / MAexp50: | +2.15% | |
| Price / MAexp100: | -0.88% |
News
The latest news and videos published on BECHTLE AG O.N. at the time of the analysis were as follows:
- DGAP-News: Bechtle Remains on Track to Success
- DGAP-Adhoc: Bechtle AG: Again strong EBT growth in Q2
- DGAP-News: Bechtle delivers impressive Q1 performance
- Megaport Announces Strategic Partnership With Bechtle as Network as a Service (NaaS) Vendor Partner
- DGAP-Adhoc: Bechtle AG: Q1 EBT very significantly above expectations
About author
Online


Add a comment
Comments
0 comments on the analysis BECHTLE AG O.N. - Daily