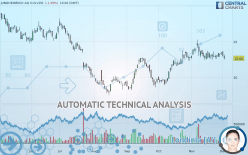
JUNGHEINRICH AG O.N.VZO - Daily - Technical analysis published on 12/03/2019 (GMT)
- Who voted?
- 138
- 0
- Timeframe : Daily
- - Analysis generated on
- Status : NEUTRAL

Summary of the analysis

Additional analysis
Quotes
The JUNGHEINRICH AG O.N.VZO rating is 22.66 EUR. On the day, this instrument lost -1.39% and was traded between 22.48 EUR and 23.18 EUR over the period. The price is currently at +0.80% from its lowest and -2.24% from its highest.Here is a more detailed summary of the historical variations registered by JUNGHEINRICH AG O.N.VZO:
Near a new LOW record (1 month)
Type : Bearish
Timeframe : Weekly
Technical
Technical analysis of JUNGHEINRICH AG O.N.VZO in Daily shows an overall slightly bullish trend. Only 57.14% of the signals given by moving averages are bullish. This slightly bullish trend could return to neutral given the neutral signals also given by short-term moving averages. The Central Indicators market scanner is currently detecting several bearish signals that could impact this trend:
Bearish trend reversal : Moving Average 20
Type : Bearish
Timeframe : Daily
Bearish trend reversal : adaptative moving average 20
Type : Bearish
Timeframe : Daily
Bearish price crossover with Moving Average 20
Type : Bearish
Timeframe : Daily
Bearish price crossover with adaptative moving average 20
Type : Bearish
Timeframe : Daily
On the 18 technical indicators analysed, 4 are bullish, 10 are neutral and 4 are bearish. Other results related to technical indicators were also found by the Central Indicators scanner:
Pivot points : price is under support 1
Type : Neutral
Timeframe : Daily
Pivot points : price is under support 1
Type : Neutral
Timeframe : Weekly
Price is back over the pivot point
Type : Bullish
Timeframe : Weekly
Williams %R indicator is back under -50
Type : Bearish
Timeframe : Daily
The Central Patterns scanner, which studies chart patterns, resistances and supports, has identified these signals:
Horizontal support is broken
Type : Bearish
Timeframe : Daily
Support of channel is broken
Type : Bearish
Timeframe : Daily
For a small setback in the very short term, the Central Candlesticks scanner currently notes the presence of this bearish pattern in Japanese candlesticks:
Bearish engulfing lines
Type : Bearish
Timeframe : Daily
| S3 | S2 | S1 | Price | R1 | R2 | R3 | |
|---|---|---|---|---|---|---|---|
| ProTrendLines | 18.05 | 19.82 | 21.45 | 22.66 | 22.75 | 24.43 | 27.28 |
| Change (%) | -20.34% | -12.53% | -5.34% | - | +0.40% | +7.81% | +20.39% |
| Change | -4.61 | -2.84 | -1.21 | - | +0.09 | +1.77 | +4.62 |
| Level | Intermediate | Minor | Major | - | Major | Major | Intermediate |
Pivot points can also be used to set your price objectives. Here is the price situation in relation to pivot points:
| Pivot points | S3 | S2 | S1 | PP | R1 | R2 | R3 |
|---|---|---|---|---|---|---|---|
| Standard | 22.05 | 22.49 | 22.73 | 23.17 | 23.41 | 23.85 | 24.09 |
| Camarilla | 22.79 | 22.86 | 22.92 | 22.98 | 23.04 | 23.11 | 23.17 |
| Woodie | 21.96 | 22.44 | 22.64 | 23.12 | 23.32 | 23.80 | 24.00 |
| Fibonacci | 22.49 | 22.75 | 22.91 | 23.17 | 23.43 | 23.59 | 23.85 |
| Pivot points | S3 | S2 | S1 | PP | R1 | R2 | R3 |
|---|---|---|---|---|---|---|---|
| Standard | 21.91 | 22.25 | 22.85 | 23.19 | 23.79 | 24.13 | 24.73 |
| Camarilla | 23.20 | 23.29 | 23.37 | 23.46 | 23.55 | 23.63 | 23.72 |
| Woodie | 22.05 | 22.32 | 22.99 | 23.26 | 23.93 | 24.20 | 24.87 |
| Fibonacci | 22.25 | 22.61 | 22.83 | 23.19 | 23.55 | 23.77 | 24.13 |
| Pivot points | S3 | S2 | S1 | PP | R1 | R2 | R3 |
|---|---|---|---|---|---|---|---|
| Standard | 19.39 | 20.93 | 22.19 | 23.73 | 24.99 | 26.53 | 27.79 |
| Camarilla | 22.69 | 22.95 | 23.20 | 23.46 | 23.72 | 23.97 | 24.23 |
| Woodie | 19.26 | 20.86 | 22.06 | 23.66 | 24.86 | 26.46 | 27.66 |
| Fibonacci | 20.93 | 22.00 | 22.66 | 23.73 | 24.80 | 25.46 | 26.53 |
Numerical data
The following is the status of technical indicators and moving averages registered at the time this technical analysis was created:
| RSI (14): | 47.03 | |
| MACD (12,26,9): | 0.1400 | |
| Directional Movement: | 3.14 | |
| AROON (14): | 14.29 | |
| DEMA (21): | 23.27 | |
| Parabolic SAR (0,02-0,02-0,2): | 23.60 | |
| Elder Ray (13): | -0.21 | |
| Super Trend (3,10): | 22.40 | |
| Zig ZAG (10): | 22.62 | |
| VORTEX (21): | 0.9400 | |
| Stochastique (14,3,5): | 41.90 | |
| TEMA (21): | 23.00 | |
| Williams %R (14): | -88.71 | |
| Chande Momentum Oscillator (20): | -0.74 | |
| Repulse (5,40,3): | -4.0700 | |
| ROCnROLL: | -1 | |
| TRIX (15,9): | 0.1700 | |
| Courbe Coppock: | 3.17 |
| MA7: | 23.03 | |
| MA20: | 23.22 | |
| MA50: | 22.07 | |
| MA100: | 21.28 | |
| MAexp7: | 23.01 | |
| MAexp20: | 23.00 | |
| MAexp50: | 22.49 | |
| MAexp100: | 22.58 | |
| Price / MA7: | -1.61% | |
| Price / MA20: | -2.41% | |
| Price / MA50: | +2.67% | |
| Price / MA100: | +6.48% | |
| Price / MAexp7: | -1.52% | |
| Price / MAexp20: | -1.48% | |
| Price / MAexp50: | +0.76% | |
| Price / MAexp100: | +0.35% |
News
Don"t forget to follow the news on JUNGHEINRICH AG O.N.VZO. At the time of publication of this analysis, the latest news was as follows:
- DGAP-Adhoc: Jungheinrich AG: Jungheinrich adjusts forecast for 2019
- DGAP-Adhoc: Jungheinrich AG: Jungheinrich makes changes to the responsibilities of the Board of Management
About author

Online


Add a comment
Comments
0 comments on the analysis JUNGHEINRICH AG O.N.VZO - Daily