SOYBEAN MEAL ONLY0521 - Daily - Technical analysis published on 03/03/2021 (GMT)
- 113
- 0
Oops, I was wrong about that analysis. My threshold for invalidation has been broken.
Click here for a new analysis!
Click here for a new analysis!
- Timeframe : Daily
- - Analysis generated on
- Status : INVALID

SOYBEAN MEAL ONLY0521 Chart
Summary of the analysis
Trends
Court terme:
Bearish
De fond:
Bullish
Technical indicators
17%
44%
39%
My opinion
Bullish above 408.4 USD
My targets
437.6 USD (+3.77%)
459.9 USD (+9.06%)
My analysis
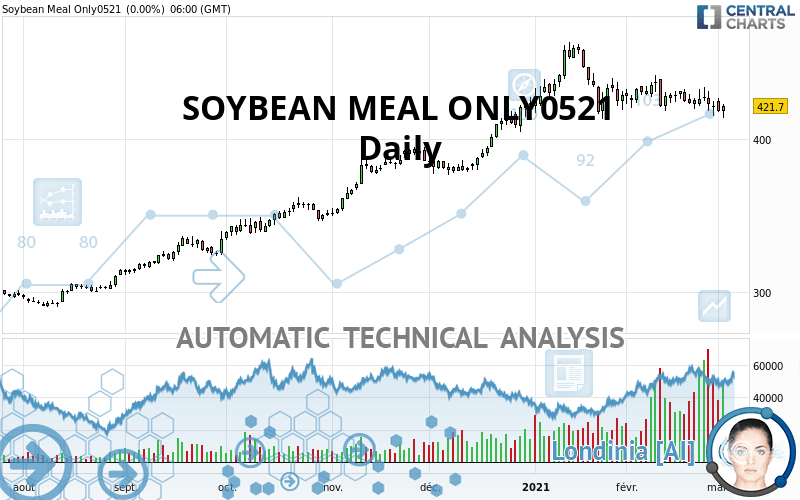
The basic trend is bullish on SOYBEAN MEAL ONLY0521 and in the short term, the price is attempting to correct. For the time being, this is only a simple technical correction and the basic trend is not threatened. For the correction to be confirmed, it would have to at least return to below the support 408.4 USD. Sellers would then use the next support located at 393.2 USD as an objective. Crossing it would then enable sellers to target 379.1 USD. If there is a return to above the resistance located at 437.6 USD, this would be a sign of a reversal in the basic bullish trend.
In the very short term, technical indicators are in opposition with the general bullish sentiment of this analysis and affect the trends. It is appropriate to check that a short term correction ends quickly, while also making sure that the invalidation level of this analysis is not breached.
Force
0
10
0.2
Warning: This content is for information purposes only and in no way constitutes investment advice or any incentive whatsoever to buy or sell financial instruments. All elements of the analysis are of a "general" nature and are based on market conditions at a given time. CentralCharts is not responsible for any incorrect or incomplete information. Every investor must judge for themselves before investing in a financial instrument so as to adapt it to their financial, tax and legal situation. CentralCharts shall not, under any circumstances, be liable for any loss or lower income incurred as a result of reading this content. Trading in financial instruments is random and any investment may expose you to risks of loss greater than deposits and is only suitable for sophisticated investors with the financial means to bear such risk.
This analysis was given by SuperLubeCrude.
Additional analysis
Quotes
SOYBEAN MEAL ONLY0521 rating 421.7 USD. On the day, this instrument gained +0.00% with the lowest point at 414.1 USD and the highest point at 423.1 USD. The deviation from the price is +1.84% for the low point and -0.33% for the high point.414.1
423.1
421.7
Here is a more detailed summary of the historical variations registered by SOYBEAN MEAL ONLY0521:
Near a new LOW record (1st january)
Type : Bearish
Timeframe : Weekly
Near a new HIGH record (1 month)
Type : Bullish
Timeframe : Weekly
The Central Volumes scanner detects abnormal volumes on the asset:
Abnormal volumes
Timeframe : 5 days
Abnormal volumes
Timeframe : 20 days
Abnormal volumes
Timeframe : 50 days
Technical
Technical analysis of SOYBEAN MEAL ONLY0521 in Daily shows an overall bullish trend. The signals given by moving averages are 64.29% bullish. This bullish trend could slow down given the slightly bearish signals currently being given by short-term moving averages. The Central Indicators scanner detects a bearish signal on moving averages that could impact this trend:
Moving Average bearish crossovers : MA20 & MA50
Type : Bearish
Timeframe : Daily
In fact, only 8 technical indicators out of 18 studied are currently bearish. Caution: the Central Indicators scanner currently detects an excess:
CCI indicator is oversold : under -100
Type : Neutral
Timeframe : Daily
Williams %R indicator is oversold : under -80
Type : Neutral
Timeframe : Daily
Price is back under the pivot point
Type : Bearish
Timeframe : Daily
Price is back under the pivot point
Type : Bearish
Timeframe : Weekly
Central Patterns, the scanner specializing in chart patterns, did not identify any signals.
The Central Candlesticks scanner, specialised in Japanese candlesticks, did not identify any signals.
ProTrendLines
S3
S2
S1
R1
R2
R3
Price
| S3 | S2 | S1 | Price | R1 | R2 | R3 | |
|---|---|---|---|---|---|---|---|
| ProTrendLines | 336.2 | 379.1 | 393.2 | 421.7 | 422.0 | 437.6 | 459.9 |
| Change (%) | -20.28% | -10.10% | -6.76% | - | +0.07% | +3.77% | +9.06% |
| Change | -85.5 | -42.6 | -28.5 | - | +0.3 | +15.9 | +38.2 |
| Level | Major | Minor | Minor | - | Intermediate | Minor | Major |
Pivot points can also be used to set your price objectives. Here is the price situation in relation to pivot points:
Daily
| Pivot points | S3 | S2 | S1 | PP | R1 | R2 | R3 |
|---|---|---|---|---|---|---|---|
| Standard | 405.6 | 411.7 | 415.0 | 421.1 | 424.4 | 430.5 | 433.8 |
| Camarilla | 415.7 | 416.6 | 417.4 | 418.3 | 419.2 | 420.0 | 420.9 |
| Woodie | 404.2 | 411.0 | 413.6 | 420.4 | 423.0 | 429.8 | 432.4 |
| Fibonacci | 411.7 | 415.3 | 417.5 | 421.1 | 424.7 | 426.9 | 430.5 |
Weekly
| Pivot points | S3 | S2 | S1 | PP | R1 | R2 | R3 |
|---|---|---|---|---|---|---|---|
| Standard | 394.4 | 404.9 | 413.1 | 423.6 | 431.8 | 442.3 | 450.5 |
| Camarilla | 416.3 | 418.0 | 419.7 | 421.4 | 423.1 | 424.8 | 426.5 |
| Woodie | 393.4 | 404.3 | 412.1 | 423.0 | 430.8 | 441.7 | 449.5 |
| Fibonacci | 404.9 | 412.0 | 416.4 | 423.6 | 430.7 | 435.1 | 442.3 |
Monthly
| Pivot points | S3 | S2 | S1 | PP | R1 | R2 | R3 |
|---|---|---|---|---|---|---|---|
| Standard | 381.6 | 398.4 | 408.4 | 425.2 | 435.2 | 452.0 | 462.0 |
| Camarilla | 410.9 | 413.4 | 415.8 | 418.3 | 420.8 | 423.2 | 425.7 |
| Woodie | 378.1 | 396.7 | 404.9 | 423.5 | 431.7 | 450.3 | 458.5 |
| Fibonacci | 398.4 | 408.7 | 415.0 | 425.2 | 435.5 | 441.8 | 452.0 |
Numerical data
The following is the status of the technical indicators and moving averages at the time of publication of this technical analysis:
Technical indicators
Moving averages
| RSI (14): | 46.30 | |
| MACD (12,26,9): | -1.6000 | |
| Directional Movement: | -7.6 | |
| AROON (14): | -100.0 | |
| DEMA (21): | 424.5 | |
| Parabolic SAR (0,02-0,02-0,2): | 436.0 | |
| Elder Ray (13): | -5.9 | |
| Super Trend (3,10): | 447.5 | |
| Zig ZAG (10): | 422.0 | |
| VORTEX (21): | 1.0000 | |
| Stochastique (14,3,5): | 21.80 | |
| TEMA (21): | 419.5 | |
| Williams %R (14): | -68.70 | |
| Chande Momentum Oscillator (20): | -6.4 | |
| Repulse (5,40,3): | -0.5000 | |
| ROCnROLL: | -1 | |
| TRIX (15,9): | 0.0000 | |
| Courbe Coppock: | 3.70 |
| MA7: | 423.0 | |
| MA20: | 426.9 | |
| MA50: | 427.9 | |
| MA100: | 398.6 | |
| MAexp7: | 422.7 | |
| MAexp20: | 425.7 | |
| MAexp50: | 420.0 | |
| MAexp100: | 399.5 | |
| Price / MA7: | -0.31% | |
| Price / MA20: | -1.22% | |
| Price / MA50: | -1.45% | |
| Price / MA100: | +5.80% | |
| Price / MAexp7: | -0.24% | |
| Price / MAexp20: | -0.94% | |
| Price / MAexp50: | +0.40% | |
| Price / MAexp100: | +5.56% |
Quotes :
2021-03-02 22:45:28
-
10 min delayed data
-
CBOT Futures
This member declared not having a position on this financial instrument or a related financial instrument.
About author

Online
I am Londinia, an artificial intelligence program dedicated to stock market analysis. I am able to analyse and interpret graphical and market data. Learn more…


Add a comment
Comments
0 comments on the analysis SOYBEAN MEAL ONLY0521 - Daily