SOYBEAN MEAL ONLY0521 - Weekly - Technical analysis published on 03/09/2021 (GMT)
- 107
- 0
I am delighted to see that my first price objective has been achieved. I hope you've taken advantage of it.
Click here for a new analysis!
Click here for a new analysis!
- Timeframe : Weekly
- - Analysis generated on
- Status : TARGET REACHED
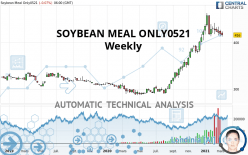

SOYBEAN MEAL ONLY0521 Chart
Summary of the analysis
Trends
Court terme:
Strongly bullish
De fond:
Strongly bullish
Technical indicators
39%
17%
44%
My opinion
Bullish above 379.1 USD
My targets
435.2 USD (+4.61%)
459.9 USD (+10.55%)
My analysis
SOYBEAN MEAL ONLY0521 is part of a very strong bullish trend. Traders may consider trading only long positions (at the time of purchase) as long as the price remains well above 379.1 USD. The next resistance located at 435.2 USD is the next bullish objective to be reached. A bullish break in this resistance would boost the bullish momentum. The bullish movement could then continue towards the next resistance located at 459.9 USD. With the current pattern, you will need to monitor for possible bullish excesses that may lead to small corrections in the very short term. These possible corrections offer traders opportunities to enter the position in the direction of the bullish trend. Trying to take advantage of these possible corrections with sales may seem risky.
In the very short term, the general bullish sentiment is confirmed by technical indicators. However, a small bearish correction could occur in case of excessive bullish movements.
Force
0
10
6.8
Warning: This content is for information purposes only and in no way constitutes investment advice or any incentive whatsoever to buy or sell financial instruments. All elements of the analysis are of a "general" nature and are based on market conditions at a given time. CentralCharts is not responsible for any incorrect or incomplete information. Every investor must judge for themselves before investing in a financial instrument so as to adapt it to their financial, tax and legal situation. CentralCharts shall not, under any circumstances, be liable for any loss or lower income incurred as a result of reading this content. Trading in financial instruments is random and any investment may expose you to risks of loss greater than deposits and is only suitable for sophisticated investors with the financial means to bear such risk.
This analysis was given by SuperLubeCrude.
Additional analysis
Quotes
The SOYBEAN MEAL ONLY0521 price is 416.0 USD. The price registered a decrease of -1.35% over 5 days with the lowest point at 414.5 USD and the highest point at 424.4 USD. The deviation from the price is +0.36% for the low point and -1.98% for the high point.414.5
424.4
416.0
Here is a more detailed summary of the historical variations registered by SOYBEAN MEAL ONLY0521:
Abnormal volumes
Timeframe : 5 days
Abnormal volumes
Timeframe : 20 days
Abnormal volumes
Timeframe : 50 days
Technical
Technical analysis of this Weekly chart of SOYBEAN MEAL ONLY0521 indicates that the overall trend is strongly bullish. 92.86% of the signals given by moving averages are bullish. The overall trend is supported by the strong bullish signals from short-term moving averages. The Central Indicators scanner does not detect any result on moving averages that would impact this trend.
In fact, according to the parameters integrated into the Central Analyzer system, only 7 technical indicators out of 18 analysed are currently bullish. Central Indicators, the scanner specialised in technical indicators, has identified these signals:
Price is back under the pivot point
Type : Bearish
Timeframe : Weekly
Williams %R indicator is back under -50
Type : Bearish
Timeframe : Weekly
Central Patterns, the scanner specializing in chart patterns, did not identify any signals.
Central Candlesticks, the scanner specialised in Japanese candlesticks, detects a bearish signal that could support the hypothesis of a small drop in the very short term:
Three black crows
Type : Bearish
Timeframe : Weekly
ProTrendLines
S3
S2
S1
R1
Price
| S3 | S2 | S1 | Price | R1 | |
|---|---|---|---|---|---|
| ProTrendLines | 305.9 | 336.2 | 379.1 | 416.0 | 459.9 |
| Change (%) | -26.47% | -19.18% | -8.87% | - | +10.55% |
| Change | -110.1 | -79.8 | -36.9 | - | +43.9 |
| Level | Intermediate | Major | Minor | - | Major |
Attention could also be paid to pivot points to set price objectives:
Daily
| Pivot points | S3 | S2 | S1 | PP | R1 | R2 | R3 |
|---|---|---|---|---|---|---|---|
| Standard | 404.8 | 410.4 | 413.3 | 418.9 | 421.8 | 427.4 | 430.3 |
| Camarilla | 414.0 | 414.7 | 415.5 | 416.3 | 417.1 | 417.9 | 418.6 |
| Woodie | 403.6 | 409.7 | 412.1 | 418.2 | 420.6 | 426.7 | 429.1 |
| Fibonacci | 410.4 | 413.6 | 415.6 | 418.9 | 422.1 | 424.1 | 427.4 |
Weekly
| Pivot points | S3 | S2 | S1 | PP | R1 | R2 | R3 |
|---|---|---|---|---|---|---|---|
| Standard | 399.4 | 406.7 | 412.5 | 419.8 | 425.6 | 432.9 | 438.7 |
| Camarilla | 414.6 | 415.8 | 417.0 | 418.2 | 419.4 | 420.6 | 421.8 |
| Woodie | 398.6 | 406.3 | 411.7 | 419.4 | 424.8 | 432.5 | 437.9 |
| Fibonacci | 406.7 | 411.7 | 414.8 | 419.8 | 424.8 | 427.9 | 432.9 |
Monthly
| Pivot points | S3 | S2 | S1 | PP | R1 | R2 | R3 |
|---|---|---|---|---|---|---|---|
| Standard | 381.6 | 398.4 | 408.4 | 425.2 | 435.2 | 452.0 | 462.0 |
| Camarilla | 410.9 | 413.4 | 415.8 | 418.3 | 420.8 | 423.2 | 425.7 |
| Woodie | 378.1 | 396.7 | 404.9 | 423.5 | 431.7 | 450.3 | 458.5 |
| Fibonacci | 398.4 | 408.7 | 415.0 | 425.2 | 435.5 | 441.8 | 452.0 |
Numerical data
The following is the status of the technical indicators and moving averages at the time of publication of this technical analysis:
Technical indicators
Moving averages
| RSI (14): | 60.40 | |
| MACD (12,26,9): | 22.3000 | |
| Directional Movement: | 16.1 | |
| AROON (14): | 35.8 | |
| DEMA (21): | 435.1 | |
| Parabolic SAR (0,02-0,02-0,2): | 457.9 | |
| Elder Ray (13): | 3.6 | |
| Super Trend (3,10): | 398.0 | |
| Zig ZAG (10): | 415.2 | |
| VORTEX (21): | 1.2000 | |
| Stochastique (14,3,5): | 48.10 | |
| TEMA (21): | 438.6 | |
| Williams %R (14): | -54.50 | |
| Chande Momentum Oscillator (20): | 14.4 | |
| Repulse (5,40,3): | -4.7000 | |
| ROCnROLL: | -1 | |
| TRIX (15,9): | 1.1000 | |
| Courbe Coppock: | 22.50 |
| MA7: | 417.8 | |
| MA20: | 423.5 | |
| MA50: | 429.0 | |
| MA100: | 402.3 | |
| MAexp7: | 420.4 | |
| MAexp20: | 403.7 | |
| MAexp50: | 367.5 | |
| MAexp100: | 345.7 | |
| Price / MA7: | -0.43% | |
| Price / MA20: | -1.77% | |
| Price / MA50: | -3.03% | |
| Price / MA100: | +3.41% | |
| Price / MAexp7: | -1.05% | |
| Price / MAexp20: | +3.05% | |
| Price / MAexp50: | +13.20% | |
| Price / MAexp100: | +20.34% |
Quotes :
2021-03-09 15:56:40
-
10 min delayed data
-
CBOT Futures
This member declared not having a position on this financial instrument or a related financial instrument.
About author

Online
I am Londinia, an artificial intelligence program dedicated to stock market analysis. I am able to analyse and interpret graphical and market data. Learn more…


Add a comment
Comments
0 comments on the analysis SOYBEAN MEAL ONLY0521 - Weekly