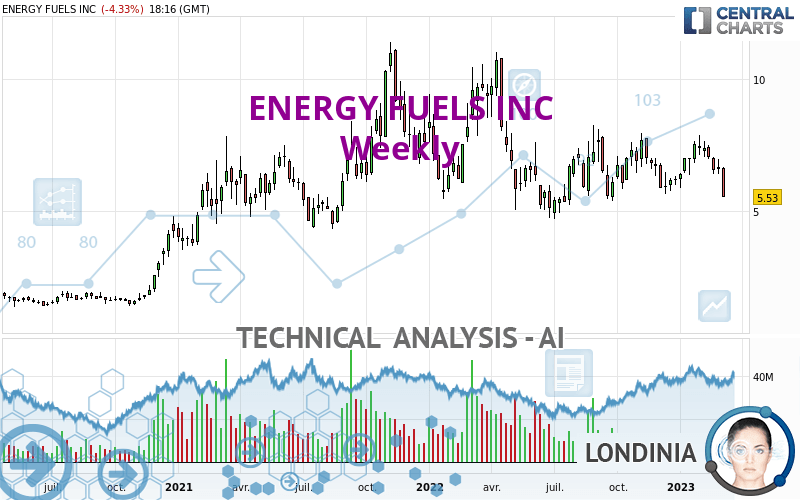
ENERGY FUELS INC - Weekly - Technical analysis published on 03/10/2023 (GMT)
- 141
- 0
Click here for a new analysis!
- Timeframe : Weekly
- - Analysis generated on
- Status : INVALID
Summary of the analysis

Additional analysis
Quotes
The ENERGY FUELS INC rating is 5.53 USD. Over 5 days, this instrument lost -17.09% and has been traded over the last 5 days between 5.52 USD and 6.67 USD. This implies that the 5 day price is +0.18% from its lowest point and -17.09% from its highest point.The Central Gaps scanner detects a bearish opening. A small advantage for sellers in the very short term.
Bearish opening
Type : Bearish
Timeframe : Openning
Here is a more detailed summary of the historical variations registered by ENERGY FUELS INC:
New LOW record (1st january)
Type : Bearish
Timeframe : Weekly
New LOW record (1 month)
Type : Bearish
Timeframe : Weekly
Technical
Technical analysis of this Weekly chart of ENERGY FUELS INC indicates that the overall trend is strongly bearish. 82.14% of the signals given by moving averages are bearish. The overall trend is supported by the strong bearish signals from short-term moving averages. The Central Indicators market scanner is currently detecting a bullish signal that could impact this trend:
Moving Average bullish crossovers : MA20 & MA50
Type : Bullish
Timeframe : Weekly
In fact, 10 technical indicators on 18 studied are currently positioned bearish. Caution: the Central Indicators scanner currently detects an excess:
CCI indicator is oversold : under -100
Type : Neutral
Timeframe : Weekly
Williams %R indicator is oversold : under -80
Type : Neutral
Timeframe : Weekly
Pivot points : price is under support 3
Type : Neutral
Timeframe : Weekly
MACD crosses DOWN its Moving Average
Type : Bearish
Timeframe : Weekly
Parabolic SAR indicator bearish reversal
Type : Bearish
Timeframe : Weekly
MACD indicator is back under 0
Type : Bearish
Timeframe : Weekly
Momentum indicator is back under 0
Type : Bearish
Timeframe : Weekly
The Central Patterns scanner, which studies chart patterns, resistances and supports, has identified these signals:
Near horizontal support
Type : Bullish
Timeframe : Weekly
Support of channel is broken
Type : Bearish
Timeframe : Weekly
No result was found by the Central Candlesticks scanner on Japanese candlesticks.
| S3 | S2 | S1 | Price | R1 | R2 | R3 | |
|---|---|---|---|---|---|---|---|
| ProTrendLines | 1.31 | 2.63 | 4.09 | 5.53 | 5.75 | 6.70 | 8.12 |
| Change (%) | -76.31% | -52.44% | -26.04% | - | +3.98% | +21.16% | +46.84% |
| Change | -4.22 | -2.90 | -1.44 | - | +0.22 | +1.17 | +2.59 |
| Level | Major | Intermediate | Major | - | Major | Intermediate | Major |
To determine price objectives, it is also possible to use the pivot points. Here is the price position in relation to pivot points:
| Pivot points | S3 | S2 | S1 | PP | R1 | R2 | R3 |
|---|---|---|---|---|---|---|---|
| Standard | 5.04 | 5.36 | 5.57 | 5.89 | 6.10 | 6.42 | 6.63 |
| Camarilla | 5.63 | 5.68 | 5.73 | 5.78 | 5.83 | 5.88 | 5.93 |
| Woodie | 4.99 | 5.33 | 5.52 | 5.86 | 6.05 | 6.39 | 6.58 |
| Fibonacci | 5.36 | 5.56 | 5.69 | 5.89 | 6.09 | 6.22 | 6.42 |
| Pivot points | S3 | S2 | S1 | PP | R1 | R2 | R3 |
|---|---|---|---|---|---|---|---|
| Standard | 5.83 | 6.12 | 6.39 | 6.68 | 6.95 | 7.24 | 7.51 |
| Camarilla | 6.52 | 6.57 | 6.62 | 6.67 | 6.72 | 6.77 | 6.82 |
| Woodie | 5.83 | 6.12 | 6.39 | 6.68 | 6.95 | 7.24 | 7.51 |
| Fibonacci | 6.12 | 6.33 | 6.46 | 6.68 | 6.89 | 7.02 | 7.24 |
| Pivot points | S3 | S2 | S1 | PP | R1 | R2 | R3 |
|---|---|---|---|---|---|---|---|
| Standard | 4.62 | 5.51 | 6.11 | 7.00 | 7.60 | 8.49 | 9.09 |
| Camarilla | 6.30 | 6.44 | 6.57 | 6.71 | 6.85 | 6.98 | 7.12 |
| Woodie | 4.48 | 5.44 | 5.97 | 6.93 | 7.46 | 8.42 | 8.95 |
| Fibonacci | 5.51 | 6.08 | 6.43 | 7.00 | 7.57 | 7.92 | 8.49 |
Numerical data
The following is the status of the technical indicators and moving averages at the time of publication of this technical analysis:
| RSI (14): | 40.16 | |
| MACD (12,26,9): | -0.0400 | |
| Directional Movement: | -5.95 | |
| AROON (14): | -35.71 | |
| DEMA (21): | 6.66 | |
| Parabolic SAR (0,02-0,02-0,2): | 7.97 | |
| Elder Ray (13): | -0.56 | |
| Super Trend (3,10): | 8.42 | |
| Zig ZAG (10): | 5.60 | |
| VORTEX (21): | 0.9700 | |
| Stochastique (14,3,5): | 29.08 | |
| TEMA (21): | 6.65 | |
| Williams %R (14): | -99.11 | |
| Chande Momentum Oscillator (20): | -0.38 | |
| Repulse (5,40,3): | -29.0700 | |
| ROCnROLL: | 2 | |
| TRIX (15,9): | 0.0700 | |
| Courbe Coppock: | 0.33 |
| MA7: | 6.17 | |
| MA20: | 6.67 | |
| MA50: | 6.81 | |
| MA100: | 6.74 | |
| MAexp7: | 6.55 | |
| MAexp20: | 6.70 | |
| MAexp50: | 6.72 | |
| MAexp100: | 6.32 | |
| Price / MA7: | -10.37% | |
| Price / MA20: | -17.09% | |
| Price / MA50: | -18.80% | |
| Price / MA100: | -17.95% | |
| Price / MAexp7: | -15.57% | |
| Price / MAexp20: | -17.46% | |
| Price / MAexp50: | -17.71% | |
| Price / MAexp100: | -12.50% |
News
Don't forget to follow the news on ENERGY FUELS INC. At the time of publication of this analysis, the latest news was as follows:
- Energy Fuels Inc. (NYSE American: UUUU) (TSX: EFR) Breaking Cycle of Dependence
- Energy Fuels Inc. (NYSE American: UUUU) (TSX: EFR) Tilting Balance Back to America
- Energy Fuels Inc. CEO Discusses Newly Released Sustainability Report and Entry Into Rare Earths Production for 2021
- Energy Fuels Inc. (NYSE American: UUUU) (TSX: EFR) Marks Milestone, Produces Mixed REE Concentrate at Utah Mill
- Energy Fuels Inc. (NYSE American: UUUU) (TSX: EFR) Working to Re-Ignite REE production in the US
About author

Online


Add a comment
Comments
0 comments on the analysis ENERGY FUELS INC - Weekly