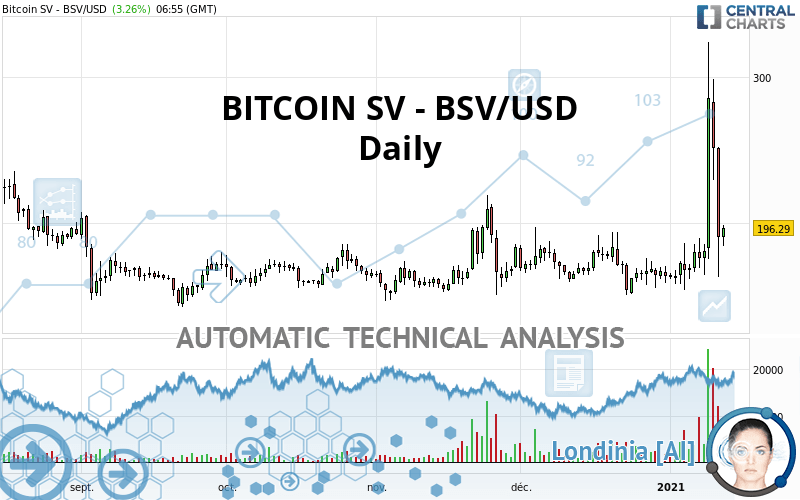
BITCOIN SV - BSV/USD - Daily - Technical analysis published on 01/12/2021 (GMT)
- 164
- 0
Click here for a new analysis!
- Timeframe : Daily
- - Analysis generated on
- Status : TARGET REACHED

Summary of the analysis

Additional analysis
Quotes
The BITCOIN SV - BSV/USD rating is 196.29 USD. The price has increased by +3.26% since the last closing with the lowest point at 183.85 USD and the highest point at 198.61 USD. The deviation from the price is +6.77% for the low point and -1.17% for the high point.The Central Gaps scanner detects a bullish opening marking the presence of buyers ahead of sellers at the opening but not sufficiently marked to allow the price to register a quotation gap.
Bullish opening
Type : Bullish
Timeframe : Openning
Here is a more detailed summary of the historical variations registered by BITCOIN SV - BSV/USD:
Abnormal volumes
Timeframe : 5 days
Abnormal volumes
Timeframe : 20 days
Abnormal volumes
Timeframe : 50 days
Technical
Technical analysis of this Daily chart of BITCOIN SV - BSV/USD indicates that the overall trend is strongly bullish. 85.71% of the signals given by moving averages are bullish. The overall trend is supported by the strong bullish signals from short-term moving averages. An assessment of moving averages reveals a bearish signal that could impact this trend:
Bearish price crossover with adaptative moving average 20
Type : Bearish
Timeframe : Daily
In fact, of the 18 technical indicators analysed by Central Analyzer, 6 are bullish, 7 are neutral and 5 are bearish. Caution: the Central Indicators scanner currently detects an excess:
Previous candle closed over Bollinger bands
Type : Neutral
Timeframe : Daily
Williams %R indicator is overbought : over -20
Type : Neutral
Timeframe : Daily
Parabolic SAR indicator bearish reversal
Type : Bearish
Timeframe : Daily
Price is back over the pivot point
Type : Bullish
Timeframe : Weekly
Price is back under the pivot point
Type : Bearish
Timeframe : Daily
Williams %R indicator is back under -50
Type : Bearish
Timeframe : Daily
Central Patterns, the market scanner focusing on chart patterns, resistances and supports found these results:
Near resistance of triangle
Type : Bearish
Timeframe : Daily
Horizontal resistance is broken
Type : Bullish
Timeframe : Daily
Resistance of channel is broken
Type : Bullish
Timeframe : Daily
The presence of a bearish pattern in Japanese candlesticks detected by Central Candlesticks that could cause a correction in the very short term was also detected:
Long black line
Type : Bearish
Timeframe : Daily
| S3 | S2 | S1 | Price | R1 | R2 | R3 | |
|---|---|---|---|---|---|---|---|
| ProTrendLines | 145.26 | 154.28 | 183.03 | 196.29 | 209.44 | 247.69 | 368.73 |
| Change (%) | -26.00% | -21.40% | -6.76% | - | +6.70% | +26.19% | +87.85% |
| Change | -51.03 | -42.01 | -13.26 | - | +13.15 | +51.40 | +172.44 |
| Level | Intermediate | Major | Intermediate | - | Intermediate | Major | Minor |
Attention could also be paid to pivot points to set price objectives:
| Pivot points | S3 | S2 | S1 | PP | R1 | R2 | R3 |
|---|---|---|---|---|---|---|---|
| Standard | 62.31 | 112.53 | 151.31 | 201.53 | 240.31 | 290.53 | 329.31 |
| Camarilla | 165.63 | 173.78 | 181.94 | 190.10 | 198.26 | 206.42 | 214.58 |
| Woodie | 56.60 | 109.67 | 145.60 | 198.67 | 234.60 | 287.67 | 323.60 |
| Fibonacci | 112.53 | 146.53 | 167.53 | 201.53 | 235.53 | 256.53 | 290.53 |
| Pivot points | S3 | S2 | S1 | PP | R1 | R2 | R3 |
|---|---|---|---|---|---|---|---|
| Standard | 15.09 | 84.54 | 185.00 | 254.45 | 354.91 | 424.36 | 524.82 |
| Camarilla | 238.74 | 254.31 | 269.89 | 285.46 | 301.04 | 316.61 | 332.19 |
| Woodie | 30.60 | 92.29 | 200.51 | 262.20 | 370.42 | 432.11 | 540.33 |
| Fibonacci | 84.54 | 149.45 | 189.54 | 254.45 | 319.36 | 359.45 | 424.36 |
| Pivot points | S3 | S2 | S1 | PP | R1 | R2 | R3 |
|---|---|---|---|---|---|---|---|
| Standard | 97.41 | 124.00 | 143.75 | 170.34 | 190.09 | 216.68 | 236.43 |
| Camarilla | 150.76 | 155.00 | 159.25 | 163.50 | 167.75 | 172.00 | 176.24 |
| Woodie | 93.99 | 122.29 | 140.33 | 168.63 | 186.67 | 214.97 | 233.01 |
| Fibonacci | 124.00 | 141.70 | 152.64 | 170.34 | 188.04 | 198.98 | 216.68 |
Numerical data
The following are the details of the technical indicators and moving averages that were collected to generate this technical analysis:
| RSI (14): | 52.24 | |
| MACD (12,26,9): | 11.4800 | |
| Directional Movement: | 15.49 | |
| AROON (14): | 35.71 | |
| DEMA (21): | 201.68 | |
| Parabolic SAR (0,02-0,02-0,2): | 320.68 | |
| Elder Ray (13): | -6.12 | |
| Super Trend (3,10): | 166.09 | |
| Zig ZAG (10): | 194.46 | |
| VORTEX (21): | 1.0300 | |
| Stochastique (14,3,5): | 34.28 | |
| TEMA (21): | 211.69 | |
| Williams %R (14): | -75.40 | |
| Chande Momentum Oscillator (20): | 32.09 | |
| Repulse (5,40,3): | -10.0200 | |
| ROCnROLL: | -1 | |
| TRIX (15,9): | 0.5300 | |
| Courbe Coppock: | 50.55 |
| MA7: | 208.48 | |
| MA20: | 180.79 | |
| MA50: | 176.59 | |
| MA100: | 171.21 | |
| MAexp7: | 205.16 | |
| MAexp20: | 189.04 | |
| MAexp50: | 178.95 | |
| MAexp100: | 175.93 | |
| Price / MA7: | -5.85% | |
| Price / MA20: | +8.57% | |
| Price / MA50: | +11.16% | |
| Price / MA100: | +14.65% | |
| Price / MAexp7: | -4.32% | |
| Price / MAexp20: | +3.84% | |
| Price / MAexp50: | +9.69% | |
| Price / MAexp100: | +11.57% |
About author

Online


Add a comment
Comments
0 comments on the analysis BITCOIN SV - BSV/USD - Daily