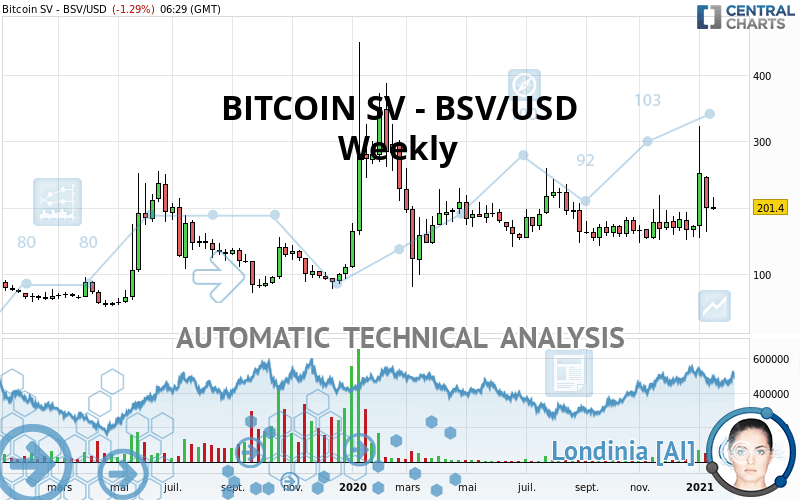
BITCOIN SV - BSV/USD - Weekly - Technical analysis published on 01/20/2021 (GMT)
- 172
- 0
Click here for a new analysis!
- Timeframe : Weekly
- - Analysis generated on
- Status : INVALID

Summary of the analysis

Additional analysis
Quotes
The BITCOIN SV - BSV/USD rating is 201.40 USD. The price registered a decrease of -9.04% over 5 days and was traded between 193.76 USD and 215.39 USD over the period. The price is currently at +3.94% from its lowest point and -6.50% from its highest point.The Central Gaps scanner detects a bearish opening marking the presence of sellers ahead of buyers at the opening but not sufficiently marked to allow the price to register a quotation gap.
Bearish opening
Type : Bearish
Timeframe : Openning
So that you have an overall view of the price change, here is a table showing the variations over several periods:
Abnormal volumes
Timeframe : 20 days
Abnormal volumes
Timeframe : 50 days
Technical
A technical analysis in Weekly of this BITCOIN SV - BSV/USD chart shows a strongly bullish trend. 82.14% of the signals given by moving averages are bullish. The overall trend is supported by the strong bullish signals from short-term moving averages. The Central Indicators scanner does not detect any result on moving averages that would impact this trend.
In fact, 13 technical indicators on 18 studied are currently bullish. Caution: the Central Indicators scanner currently detects an excess:
CCI indicator is overbought : over 100
Type : Neutral
Timeframe : Weekly
Previous candle closed over Bollinger bands
Type : Neutral
Timeframe : Weekly
Williams %R indicator is overbought : over -20
Type : Neutral
Timeframe : Weekly
Price is back under the pivot point
Type : Bearish
Timeframe : Weekly
Williams %R indicator is back under -50
Type : Bearish
Timeframe : Weekly
Central Patterns, the market scanner focusing on chart patterns, resistances and supports found these results:
Horizontal resistance is broken
Type : Bullish
Timeframe : Weekly
Resistance of triangle is broken
Type : Bullish
Timeframe : Weekly
Central Candlesticks, the scanner specialised in Japanese candlesticks, detects these bearish signals that could support the hypothesis of a small drop in the very short term:
Bearish harami
Type : Bearish
Timeframe : Weekly
Long black line
Type : Bearish
Timeframe : Weekly
| S3 | S2 | S1 | Price | R1 | R2 | R3 | |
|---|---|---|---|---|---|---|---|
| ProTrendLines | 80.66 | 145.26 | 181.16 | 201.40 | 209.44 | 247.69 | 368.73 |
| Change (%) | -59.95% | -27.87% | -10.05% | - | +3.99% | +22.98% | +83.08% |
| Change | -120.74 | -56.14 | -20.24 | - | +8.04 | +46.29 | +167.33 |
| Level | Major | Major | Major | - | Major | Major | Minor |
Attention could also be paid to pivot points to set price objectives:
| Pivot points | S3 | S2 | S1 | PP | R1 | R2 | R3 |
|---|---|---|---|---|---|---|---|
| Standard | 187.88 | 195.79 | 199.91 | 207.82 | 211.94 | 219.85 | 223.97 |
| Camarilla | 200.73 | 201.83 | 202.94 | 204.04 | 205.14 | 206.25 | 207.35 |
| Woodie | 186.00 | 194.84 | 198.03 | 206.87 | 210.06 | 218.90 | 222.09 |
| Fibonacci | 195.79 | 200.38 | 203.22 | 207.82 | 212.41 | 215.25 | 219.85 |
| Pivot points | S3 | S2 | S1 | PP | R1 | R2 | R3 |
|---|---|---|---|---|---|---|---|
| Standard | 10.76 | 86.75 | 146.36 | 222.35 | 281.96 | 357.95 | 417.56 |
| Camarilla | 168.68 | 181.11 | 193.54 | 205.97 | 218.40 | 230.83 | 243.26 |
| Woodie | 2.57 | 82.66 | 138.17 | 218.26 | 273.77 | 353.86 | 409.37 |
| Fibonacci | 86.75 | 138.55 | 170.55 | 222.35 | 274.15 | 306.15 | 357.95 |
| Pivot points | S3 | S2 | S1 | PP | R1 | R2 | R3 |
|---|---|---|---|---|---|---|---|
| Standard | 97.41 | 124.00 | 143.75 | 170.34 | 190.09 | 216.68 | 236.43 |
| Camarilla | 150.76 | 155.00 | 159.25 | 163.50 | 167.75 | 172.00 | 176.24 |
| Woodie | 93.99 | 122.29 | 140.33 | 168.63 | 186.67 | 214.97 | 233.01 |
| Fibonacci | 124.00 | 141.70 | 152.64 | 170.34 | 188.04 | 198.98 | 216.68 |
Numerical data
The following are the details of the technical indicators and moving averages that were collected to generate this technical analysis:
| RSI (14): | 52.30 | |
| MACD (12,26,9): | 6.6000 | |
| Directional Movement: | 21.18 | |
| AROON (14): | 64.28 | |
| DEMA (21): | 193.44 | |
| Parabolic SAR (0,02-0,02-0,2): | 89.35 | |
| Elder Ray (13): | 13.23 | |
| Super Trend (3,10): | 101.03 | |
| Zig ZAG (10): | 200.75 | |
| VORTEX (21): | 1.0100 | |
| Stochastique (14,3,5): | 47.56 | |
| TEMA (21): | 199.69 | |
| Williams %R (14): | -69.36 | |
| Chande Momentum Oscillator (20): | 35.65 | |
| Repulse (5,40,3): | -12.8400 | |
| ROCnROLL: | 1 | |
| TRIX (15,9): | -0.0200 | |
| Courbe Coppock: | 38.66 |
| MA7: | 206.48 | |
| MA20: | 197.34 | |
| MA50: | 181.32 | |
| MA100: | 174.44 | |
| MAexp7: | 200.06 | |
| MAexp20: | 187.46 | |
| MAexp50: | 179.57 | |
| MAexp100: | 161.58 | |
| Price / MA7: | -2.46% | |
| Price / MA20: | +2.06% | |
| Price / MA50: | +11.07% | |
| Price / MA100: | +15.46% | |
| Price / MAexp7: | +0.67% | |
| Price / MAexp20: | +7.44% | |
| Price / MAexp50: | +12.16% | |
| Price / MAexp100: | +24.64% |
About author

Online


Add a comment
Comments
0 comments on the analysis BITCOIN SV - BSV/USD - Weekly