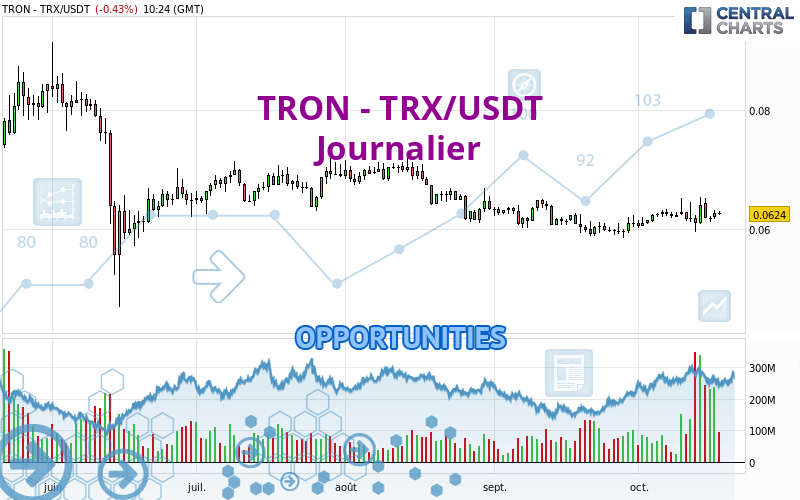
Londinia Opportunities Analyses - 05/24/2022 (GMT) TRON - TRX/USDT - Daily
| Type: | Cryptocurrencies |
| Ticker: | TRXUSDT |
| ISIN: |
I am delighted to see that my first price objective has been achieved. I hope you've taken advantage of it.
- Cryptocurrencies
- Timeframe : Daily
- - Analysis generated on
- Status : TARGET REACHED
Summary of the analysis
Trends
Short term:
Bullish
Underlying:
Strongly bullish
Technical indicators
78%
6%
17%
My opinion
Bullish above 0.074930 USDT
My targets
0.081637 USDT (+5.51%)
0.090600 USDT (+17.10%)
My analysis
All elements being clearly bullish, it would be possible for traders to trade only long positions (at the time of purchase) on TRON - TRX/USDT as long as the price remains well above 0.074930 USDT. The buyers' bullish objective is set at 0.081637 USDT. A bullish break in this resistance would boost the bullish momentum. The buyers could then target the resistance located at 0.090600 USDT. If there is any crossing, the next objective would be the resistance located at 0.097500 USDT. Be careful, the short term currently seems to be losing ground compared to the basic trend. Longer time units should be analysed to identify possible overbought items that could be a sign of a possible short-term correction.
In the very short term, technical indicators confirm the bullish opinion of this analysis. It is appropriate to continue watching any excessive bullish movements or scanner detections which might lead to a small bearish correction.
Force
0
10
7.7

Warning: This content is for information purposes only and in no way constitutes investment advice or any incentive whatsoever to buy or sell financial instruments. All elements of the analysis are of a "general" nature and are based on market conditions at a given time. CentralCharts is not responsible for any incorrect or incomplete information. Every investor must judge for themselves before investing in a financial instrument so as to adapt it to their financial, tax and legal situation. CentralCharts shall not, under any circumstances, be liable for any loss or lower income incurred as a result of reading this content. Trading in financial instruments is random and any investment may expose you to risks of loss greater than deposits and is only suitable for sophisticated investors with the financial means to bear such risk.
Additional analysis
Quotes
The TRON - TRX/USDT price is 0.077370 USDT. The price registered an increase of +1.60% on the session and was traded between 0.075990 USDT and 0.077830 USDT over the period. The price is currently at +1.82% from its lowest and -0.59% from its highest.0.075990
0.077830
0.077370
The Central Gaps scanner detects a bullish opening. A small advantage for buyers in the very short term.
Bullish opening
Type : Bullish
Timeframe : Openning
Here is a more detailed summary of the historical variations registered by TRON - TRX/USDT:
Technical
A technical analysis in Journalier of this TRON - TRX/USDT chart shows a strongly bullish trend. The signals given by moving averages are 89.29% bullish. This strongly bullish trend seems to be running out of steam given the signals being given by short-term moving averages. The Central Indicators market scanner currently does not detect any result that concerns moving averages.
The probability of a further increase is high given the direction of the technical indicators.
Central Indicators, the scanner specialised in technical indicators, has identified this signal:
MACD crosses UP its Moving Average
Type : Bullish
Timeframe : Daily
Central Patterns, the market scanner focusing on chart patterns, resistances and supports found this result:
Near resistance of channel
Type : Bearish
Timeframe : Daily
Central Candlesticks, the scanner specialised in Japanese candlesticks, detects these bullish signals that could support the hypothesis of a small rebound in the very short term:
Bullish harami
Type : Bullish
Timeframe : Daily
Bullish harami cross
Type : Bullish
Timeframe : Daily
ProTrendLines
S3
S2
S1
R1
R2
R3
Price
| S3 | S2 | S1 | Price | R1 | R2 | R3 | |
|---|---|---|---|---|---|---|---|
| ProTrendLines | 0.055060 | 0.067207 | 0.074930 | 0.077370 | 0.090600 | 0.097500 | 0.114400 |
| Change (%) | -28.84% | -13.14% | -3.15% | - | +17.10% | +26.02% | +47.86% |
| Change | -0.022310 | -0.010163 | -0.002440 | - | +0.013230 | +0.020130 | +0.037030 |
| Level | Major | Intermediate | Major | - | Intermediate | Minor | Minor |
Attention could also be paid to pivot points to set price objectives:
Daily
| Pivot points | S3 | S2 | S1 | PP | R1 | R2 | R3 |
|---|---|---|---|---|---|---|---|
| Standard | 0.067200 | 0.071510 | 0.073830 | 0.078140 | 0.080460 | 0.084770 | 0.087090 |
| Camarilla | 0.074327 | 0.074935 | 0.075542 | 0.076150 | 0.076758 | 0.077366 | 0.077973 |
| Woodie | 0.066205 | 0.071013 | 0.072835 | 0.077643 | 0.079465 | 0.084273 | 0.086095 |
| Fibonacci | 0.071510 | 0.074043 | 0.075607 | 0.078140 | 0.080673 | 0.082237 | 0.084770 |
Weekly
| Pivot points | S3 | S2 | S1 | PP | R1 | R2 | R3 |
|---|---|---|---|---|---|---|---|
| Standard | 0.060287 | 0.063713 | 0.068877 | 0.072303 | 0.077467 | 0.080893 | 0.086057 |
| Camarilla | 0.071678 | 0.072465 | 0.073253 | 0.074040 | 0.074827 | 0.075615 | 0.076402 |
| Woodie | 0.061155 | 0.064148 | 0.069745 | 0.072738 | 0.078335 | 0.081328 | 0.086925 |
| Fibonacci | 0.063713 | 0.066995 | 0.069022 | 0.072303 | 0.075585 | 0.077612 | 0.080893 |
Monthly
| Pivot points | S3 | S2 | S1 | PP | R1 | R2 | R3 |
|---|---|---|---|---|---|---|---|
| Standard | 0.038813 | 0.048297 | 0.055483 | 0.064967 | 0.072153 | 0.081637 | 0.088823 |
| Camarilla | 0.058086 | 0.059614 | 0.061142 | 0.062670 | 0.064198 | 0.065726 | 0.067254 |
| Woodie | 0.037665 | 0.047723 | 0.054335 | 0.064393 | 0.071005 | 0.081063 | 0.087675 |
| Fibonacci | 0.048297 | 0.054665 | 0.058599 | 0.064967 | 0.071335 | 0.075269 | 0.081637 |
Numerical data
The following is the status of technical indicators and moving averages registered at the time this technical analysis was created:
Technical indicators
Moving averages
| RSI (14): | 55.03 | |
| MACD (12,26,9): | 0.0015 | |
| Directional Movement: | 8.554321 | |
| AROON (14): | 0 | |
| DEMA (21): | 0.075822 | |
| Parabolic SAR (0,02-0,02-0,2): | 0.062938 | |
| Elder Ray (13): | 0.002446 | |
| Super Trend (3,10): | 0.060879 | |
| Zig ZAG (10): | 0.077590 | |
| VORTEX (21): | 1.0402 | |
| Stochastique (14,3,5): | 65.46 | |
| TEMA (21): | 0.075643 | |
| Williams %R (14): | -29.20 | |
| Chande Momentum Oscillator (20): | 0.010340 | |
| Repulse (5,40,3): | 1.7875 | |
| ROCnROLL: | 1 | |
| TRIX (15,9): | 0.3023 | |
| Courbe Coppock: | 6.48 |
| MA7: | 0.074516 | |
| MA20: | 0.075292 | |
| MA50: | 0.069044 | |
| MA100: | 0.066235 | |
| MAexp7: | 0.075292 | |
| MAexp20: | 0.073745 | |
| MAexp50: | 0.070859 | |
| MAexp100: | 0.069891 | |
| Price / MA7: | +3.83% | |
| Price / MA20: | +2.76% | |
| Price / MA50: | +12.06% | |
| Price / MA100: | +16.81% | |
| Price / MAexp7: | +2.76% | |
| Price / MAexp20: | +4.92% | |
| Price / MAexp50: | +9.19% | |
| Price / MAexp100: | +10.70% |
Quotes :
-
Real time data
-
Cryptocompare