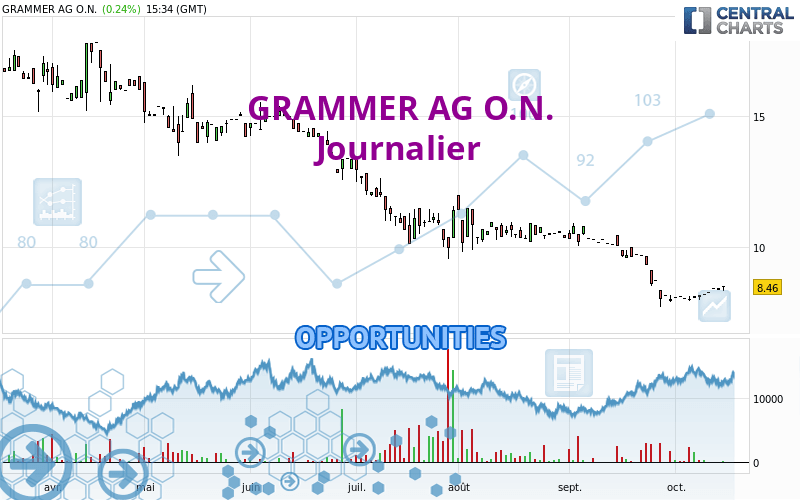
Londinia Opportunities Analyses - 06/24/2022 (GMT) GRAMMER AG O.N. - Daily
-
EUR
(-)
-
15 min delayed data - Germany Stocks
| Type: | Stocks |
| Ticker: | GMM |
| ISIN: | DE0005895403 |
I am delighted to see that my first price objective has been achieved. I hope you've taken advantage of it.
- Europe Stocks
- Timeframe : Daily
- - Analysis generated on
- Status : TARGET REACHED
Summary of the analysis
Trends
Short term:
Strongly bearish
Underlying:
Strongly bearish
Technical indicators
11%
72%
17%
My opinion
Bearish under 14.00 EUR
My targets
12.71 EUR (-6.89%)
10.23 EUR (-25.03%)
My analysis
All elements being clearly bearish, it would be possible for traders to trade only short positions (for sale) on GRAMMER AG O.N. as long as the price remains well below 14.00 EUR. The sellers' bearish objective is set at 12.71 EUR. A bearish break of this support would revive the bearish momentum. The sellers could then target the support located at 10.23 EUR. In case of crossing, the next objective would be the support located at 2.32 EUR. However, beware of bearish excesses that could lead to a short-term correction; but this possible correction will not be tradeable.
Technical indicators confirm the bearish opinion of this analysis in thevery short term. However, be careful of excessive bearish movements. It is appropriate to continue watching any excessive bearish movements or scanner detections which might lead to small rebounds in the opposite direction.
Force
0
10
8

Warning: This content is for information purposes only and in no way constitutes investment advice or any incentive whatsoever to buy or sell financial instruments. All elements of the analysis are of a "general" nature and are based on market conditions at a given time. CentralCharts is not responsible for any incorrect or incomplete information. Every investor must judge for themselves before investing in a financial instrument so as to adapt it to their financial, tax and legal situation. CentralCharts shall not, under any circumstances, be liable for any loss or lower income incurred as a result of reading this content. Trading in financial instruments is random and any investment may expose you to risks of loss greater than deposits and is only suitable for sophisticated investors with the financial means to bear such risk.
Additional analysis
Quotes
GRAMMER AG O.N. rating 13.65 EUR. The price is lower by -1.80% since the last closing with the lowest point at 13.50 EUR and the highest point at 13.65 EUR. The deviation from the price is +1.11% for the low point and 0% for the high point.13.50
13.65
13.65
The Central Gaps scanner detects a bearish gap which is a sign that the sellers have taken the lead in the very short term.
Opening Gap DOWN
Type : Bearish
Timeframe : Openning
Here is a more detailed summary of the historical variations registered by GRAMMER AG O.N.:
New LOW record (1 year)
Type : Bearish
Timeframe : Weekly
New LOW record (1st january)
Type : Bearish
Timeframe : Weekly
New LOW record (1 month)
Type : Bearish
Timeframe : Weekly
Technical
Technical analysis of this Journalier chart of GRAMMER AG O.N. indicates that the overall trend is strongly bearish. 92.86% of the signals given by moving averages are bearish. The overall trend is supported by the strong bearish signals from short-term moving averages. The Central Indicators market scanner currently does not detect any result that concerns moving averages.
The probability of a further decline is high given the direction of the technical indicators.
Caution: the Central Indicators scanner currently detects an excess:
CCI indicator is oversold : under -100
Type : Neutral
Timeframe : Daily
Williams %R indicator is oversold : under -80
Type : Neutral
Timeframe : Daily
Pivot points : price is under support 1
Type : Neutral
Timeframe : Daily
Pivot points : price is under support 3
Type : Neutral
Timeframe : Weekly
Central Patterns, the market scanner focusing on chart patterns, resistances and supports found this result:
Near support of channel
Type : Bullish
Timeframe : Daily
Central Candlesticks, the scanner specialised in Japanese candlesticks, detects a bullish signal that could support the hypothesis of a small rebound in the very short term:
Bullish doji star
Type : Bullish
Timeframe : Daily
ProTrendLines
S2
S1
R1
R2
R3
Price
| S2 | S1 | Price | R1 | R2 | R3 | |
|---|---|---|---|---|---|---|
| ProTrendLines | 2.32 | 12.71 | 13.65 | 14.00 | 15.18 | 17.70 |
| Change (%) | -83.00% | -6.89% | - | +2.56% | +11.21% | +29.67% |
| Change | -11.33 | -0.94 | - | +0.35 | +1.53 | +4.05 |
| Level | Minor | Major | - | Intermediate | Minor | Major |
Attention could also be paid to pivot points to set price objectives:
Daily
| Pivot points | S3 | S2 | S1 | PP | R1 | R2 | R3 |
|---|---|---|---|---|---|---|---|
| Standard | 13.17 | 13.53 | 13.72 | 14.08 | 14.27 | 14.63 | 14.82 |
| Camarilla | 13.75 | 13.80 | 13.85 | 13.90 | 13.95 | 14.00 | 14.05 |
| Woodie | 13.08 | 13.49 | 13.63 | 14.04 | 14.18 | 14.59 | 14.73 |
| Fibonacci | 13.53 | 13.74 | 13.87 | 14.08 | 14.29 | 14.42 | 14.63 |
Weekly
| Pivot points | S3 | S2 | S1 | PP | R1 | R2 | R3 |
|---|---|---|---|---|---|---|---|
| Standard | 13.27 | 13.73 | 14.07 | 14.53 | 14.87 | 15.33 | 15.67 |
| Camarilla | 14.18 | 14.25 | 14.33 | 14.40 | 14.47 | 14.55 | 14.62 |
| Woodie | 13.20 | 13.70 | 14.00 | 14.50 | 14.80 | 15.30 | 15.60 |
| Fibonacci | 13.73 | 14.04 | 14.23 | 14.53 | 14.84 | 15.03 | 15.33 |
Monthly
| Pivot points | S3 | S2 | S1 | PP | R1 | R2 | R3 |
|---|---|---|---|---|---|---|---|
| Standard | 10.23 | 11.87 | 13.03 | 14.67 | 15.83 | 17.47 | 18.63 |
| Camarilla | 13.43 | 13.69 | 13.94 | 14.20 | 14.46 | 14.71 | 14.97 |
| Woodie | 10.00 | 11.75 | 12.80 | 14.55 | 15.60 | 17.35 | 18.40 |
| Fibonacci | 11.87 | 12.94 | 13.60 | 14.67 | 15.74 | 16.40 | 17.47 |
Numerical data
The following is the status of the technical indicators and moving averages at the time of publication of this technical analysis:
Technical indicators
Moving averages
| RSI (14): | 33.97 | |
| MACD (12,26,9): | -0.3000 | |
| Directional Movement: | -15.99 | |
| AROON (14): | -78.57 | |
| DEMA (21): | 14.08 | |
| Parabolic SAR (0,02-0,02-0,2): | 15.67 | |
| Elder Ray (13): | -0.73 | |
| Super Trend (3,10): | 14.71 | |
| Zig ZAG (10): | 13.65 | |
| VORTEX (21): | 0.7600 | |
| Stochastique (14,3,5): | 2.63 | |
| TEMA (21): | 14.03 | |
| Williams %R (14): | -92.11 | |
| Chande Momentum Oscillator (20): | -1.35 | |
| Repulse (5,40,3): | -2.6100 | |
| ROCnROLL: | 2 | |
| TRIX (15,9): | -0.1900 | |
| Courbe Coppock: | 9.58 |
| MA7: | 14.12 | |
| MA20: | 14.56 | |
| MA50: | 15.01 | |
| MA100: | 16.09 | |
| MAexp7: | 14.08 | |
| MAexp20: | 14.45 | |
| MAexp50: | 15.03 | |
| MAexp100: | 16.02 | |
| Price / MA7: | -3.33% | |
| Price / MA20: | -6.25% | |
| Price / MA50: | -9.06% | |
| Price / MA100: | -15.16% | |
| Price / MAexp7: | -3.05% | |
| Price / MAexp20: | -5.54% | |
| Price / MAexp50: | -9.18% | |
| Price / MAexp100: | -14.79% |
Quotes :
-
15 min delayed data
-
Actions Allemagne
News
Don't forget to follow the news on GRAMMER AG O.N.. At the time of publication of this analysis, the latest news was as follows:
- DGAP-Adhoc: GRAMMER AG: Thorsten Seehars leaves GRAMMER at the end of May 2022
- DGAP-News: GRAMMER AG Publishes Figures for Q1 2022 and Outlook for 2025
- DGAP-Adhoc: GRAMMER AG: Earnings development in first quarter of 2022 significantly below prior-year level
- DGAP-News: GRAMMER designates two new candidates for the Supervisory Board
- FOX Nation to Debut New American History Series Hosted by Kelsey Grammer