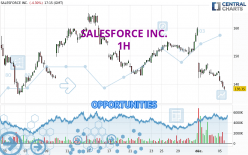
Londinia Opportunities Analyses - 12/05/2022 (GMT) SALESFORCE INC. - 1H
I am delighted to see that my first price objective has been achieved. I hope you've taken advantage of it.
- U.S. Stocks
- Timeframe : 1H
- - Analysis generated on
- Status : TARGET REACHED
Summary of the analysis
Trends
Short term:
Strongly bearish
Underlying:
Strongly bearish
Technical indicators
6%
89%
6%
My opinion
Bearish under 139.72 USD
My targets
136.04 USD (-1.94%)
130.79 USD (-5.72%)
My analysis
The bearish trend is currently very strong for SALESFORCE INC.. As long as the price remains below the resistance at 139.72 USD, you could try to take advantage of the bearish rally. The first bearish objective is located at 136.04 USD. The bearish momentum would be revived by a break in this support. Sellers would then use the next support located at 130.79 USD as an objective. Crossing it would then enable sellers to target 123.09 USD. Be careful, given the powerful bearish rally underway, excesses could lead to a short-term rebound. If this is the case, remember that trading against the trend may be riskier. It would seem more appropriate to wait for a signal indicating reversal of the trend.
Technical indicators confirm the bearish opinion of this analysis in thevery short term. However, be careful of excessive bearish movements. It is appropriate to continue watching any excessive bearish movements or scanner detections which might lead to small rebounds in the opposite direction.
Force
0
10
8.8

Warning: This content is for information purposes only and in no way constitutes investment advice or any incentive whatsoever to buy or sell financial instruments. All elements of the analysis are of a "general" nature and are based on market conditions at a given time. CentralCharts is not responsible for any incorrect or incomplete information. Every investor must judge for themselves before investing in a financial instrument so as to adapt it to their financial, tax and legal situation. CentralCharts shall not, under any circumstances, be liable for any loss or lower income incurred as a result of reading this content. Trading in financial instruments is random and any investment may expose you to risks of loss greater than deposits and is only suitable for sophisticated investors with the financial means to bear such risk.
Additional analysis
Quotes
SALESFORCE INC. rating 138.73 USD. The price registered a decrease of -4.03% on the session with the lowest point at 138.63 USD and the highest point at 144.39 USD. The deviation from the price is +0.07% for the low point and -3.92% for the high point.138.63
144.39
138.73
The Central Gaps scanner detects a bearish opening. A small advantage for sellers in the very short term.
Bearish opening
Type : Bearish
Timeframe : Openning
So that you have an overall view of the price change, here is a table showing the variations over several periods:
Near a new LOW record (1 year)
Type : Bearish
Timeframe : Weekly
Near a new LOW record (1st january)
Type : Bearish
Timeframe : Weekly
Near a new LOW record (1 month)
Type : Bearish
Timeframe : Weekly
The Central Volumes scanner notes the presence of abnormal volumes:
Abnormal volumes
Timeframe : 5 days
Technical
Technical analysis of SALESFORCE INC. in 1H shows a overall strongly bearish trend. 92.86% of the signals given by moving averages are bearish. The overall trend is supported by the strong bearish signals from short-term moving averages. The Central Indicators scanner does not detect any result on moving averages that would impact this trend.
In fact, 16 technical indicators on 18 studied are currently positioned bearish. Caution: the Central Indicators scanner currently detects an excess:
CCI indicator is oversold : under -100
Type : Neutral
Timeframe : 1 hour
Williams %R indicator is oversold : under -80
Type : Neutral
Timeframe : 1 hour
Pivot points : price is under support 3
Type : Neutral
Timeframe : 1 hour
The Central Patterns scanner, which studies chart patterns, resistances and supports, has identified this signal:
Support of channel is broken
Type : Bearish
Timeframe : 1 hour
The Central Candlesticks scanner, specialised in Japanese candlesticks, did not identify any signals.
ProTrendLines
S3
S2
S1
R1
R2
R3
Price
| S3 | S2 | S1 | Price | R1 | R2 | R3 | |
|---|---|---|---|---|---|---|---|
| ProTrendLines | 67.08 | 123.09 | 136.04 | 138.73 | 139.72 | 142.03 | 147.46 |
| Change (%) | -51.65% | -11.27% | -1.94% | - | +0.71% | +2.38% | +6.29% |
| Change | -71.65 | -15.64 | -2.69 | - | +0.99 | +3.30 | +8.73 |
| Level | Minor | Major | Minor | - | Major | Intermediate | Minor |
Attention could also be paid to pivot points to set price objectives:
Daily
| Pivot points | S3 | S2 | S1 | PP | R1 | R2 | R3 |
|---|---|---|---|---|---|---|---|
| Standard | 140.73 | 141.75 | 143.16 | 144.18 | 145.59 | 146.61 | 148.02 |
| Camarilla | 143.89 | 144.12 | 144.34 | 144.56 | 144.78 | 145.01 | 145.23 |
| Woodie | 140.92 | 141.85 | 143.35 | 144.28 | 145.78 | 146.71 | 148.21 |
| Fibonacci | 141.75 | 142.68 | 143.26 | 144.18 | 145.11 | 145.69 | 146.61 |
Weekly
| Pivot points | S3 | S2 | S1 | PP | R1 | R2 | R3 |
|---|---|---|---|---|---|---|---|
| Standard | 119.51 | 130.79 | 137.68 | 148.96 | 155.85 | 167.13 | 174.02 |
| Camarilla | 139.56 | 141.23 | 142.89 | 144.56 | 146.23 | 147.89 | 149.56 |
| Woodie | 117.31 | 129.69 | 135.48 | 147.86 | 153.65 | 166.03 | 171.82 |
| Fibonacci | 130.79 | 137.73 | 142.02 | 148.96 | 155.90 | 160.19 | 167.13 |
Monthly
| Pivot points | S3 | S2 | S1 | PP | R1 | R2 | R3 |
|---|---|---|---|---|---|---|---|
| Standard | 112.63 | 124.34 | 142.29 | 154.00 | 171.95 | 183.66 | 201.61 |
| Camarilla | 152.09 | 154.81 | 157.53 | 160.25 | 162.97 | 165.69 | 168.41 |
| Woodie | 115.76 | 125.90 | 145.42 | 155.56 | 175.08 | 185.22 | 204.74 |
| Fibonacci | 124.34 | 135.67 | 142.67 | 154.00 | 165.33 | 172.33 | 183.66 |
Numerical data
The following is the status of the technical indicators and moving averages at the time of publication of this technical analysis:
Technical indicators
Moving averages
| RSI (14): | 30.14 | |
| MACD (12,26,9): | -2.6600 | |
| Directional Movement: | -22.52 | |
| AROON (14): | -71.43 | |
| DEMA (21): | 141.69 | |
| Parabolic SAR (0,02-0,02-0,2): | 154.53 | |
| Elder Ray (13): | -3.47 | |
| Super Trend (3,10): | 146.27 | |
| Zig ZAG (10): | 139.40 | |
| VORTEX (21): | 0.8900 | |
| Stochastique (14,3,5): | 5.51 | |
| TEMA (21): | 140.11 | |
| Williams %R (14): | -95.91 | |
| Chande Momentum Oscillator (20): | -5.95 | |
| Repulse (5,40,3): | -2.4200 | |
| ROCnROLL: | 2 | |
| TRIX (15,9): | -0.2200 | |
| Courbe Coppock: | 8.84 |
| MA7: | 149.96 | |
| MA20: | 150.88 | |
| MA50: | 151.53 | |
| MA100: | 161.62 | |
| MAexp7: | 141.87 | |
| MAexp20: | 144.98 | |
| MAexp50: | 147.96 | |
| MAexp100: | 149.62 | |
| Price / MA7: | -7.49% | |
| Price / MA20: | -8.05% | |
| Price / MA50: | -8.45% | |
| Price / MA100: | -14.16% | |
| Price / MAexp7: | -2.21% | |
| Price / MAexp20: | -4.31% | |
| Price / MAexp50: | -6.24% | |
| Price / MAexp100: | -7.28% |
Quotes :
-
15 min delayed data
-
Actions NYSE
News
Don't forget to follow the news on SALESFORCE INC.. At the time of publication of this analysis, the latest news was as follows:
- RBC Wealth Management's U.S. Business Increases Efficiency, Delivers on Client Expectations with Salesforce
- Bret Taylor to Step Down as Salesforce Vice Chair and Co-CEO; Marc Benioff to be Chair and CEO
- Salesforce Announces Solid Third Quarter Fiscal 2023 Results
- Salesforce Reveals Record-Breaking Cyber Week: $281 Billion in Global Online Sales
- "CROWN ROYAL PARTNERS WITH SALESFORCE, CROSSMINT AND VAYNER3 TO LAUNCH FIRST ENTRY INTO DIGITAL COLLECTIBLES THIS GIVING TUESDAY"