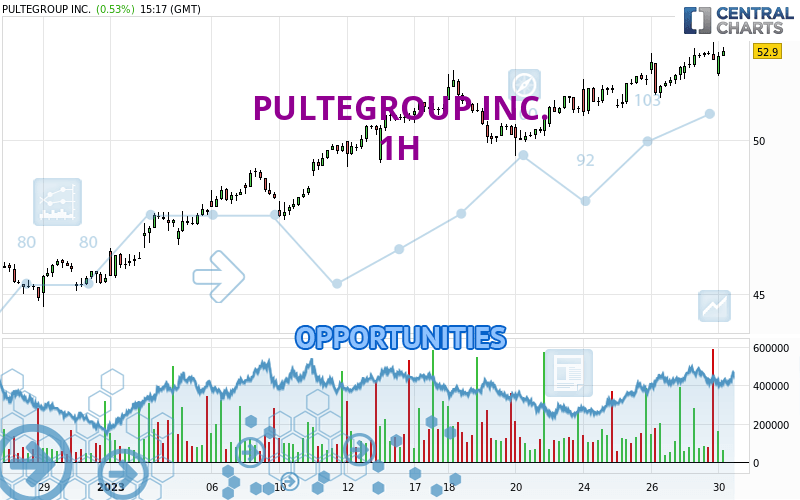
Londinia Opportunities Analyses - 01/30/2023 (GMT) PULTEGROUP INC. - 1H
- U.S. Stocks
- Timeframe : 1H
- - Analysis generated on
- Status : INVALID
Summary of the analysis
Trends
Short term:
Strongly bullish
Underlying:
Strongly bullish
Technical indicators
78%
0%
22%
My opinion
Bullish above 52.28 USD
My targets
54.85 USD (+3.54%)
56.85 USD (+7.32%)
My analysis
PULTEGROUP INC. is part of a very strong bullish trend. Traders may consider trading only long positions (at the time of purchase) as long as the price remains well above 52.28 USD. The next resistance located at 54.85 USD is the next bullish objective to be reached. A bullish break in this resistance would boost the bullish momentum. The bullish movement could then continue towards the next resistance located at 56.85 USD. After this resistance, buyers could then target 60.99 USD. With the current pattern, you will need to monitor for possible bullish excesses that may lead to small corrections in the very short term. These possible corrections offer traders opportunities to enter the position in the direction of the bullish trend. Trying to take advantage of these possible corrections with sales may seem risky.
In the very short term, the general bullish sentiment is confirmed by technical indicators. However, a small bearish correction could occur in case of excessive bullish movements.
Force
0
10
8.6

Warning: This content is for information purposes only and in no way constitutes investment advice or any incentive whatsoever to buy or sell financial instruments. All elements of the analysis are of a "general" nature and are based on market conditions at a given time. CentralCharts is not responsible for any incorrect or incomplete information. Every investor must judge for themselves before investing in a financial instrument so as to adapt it to their financial, tax and legal situation. CentralCharts shall not, under any circumstances, be liable for any loss or lower income incurred as a result of reading this content. Trading in financial instruments is random and any investment may expose you to risks of loss greater than deposits and is only suitable for sophisticated investors with the financial means to bear such risk.
Additional analysis
Quotes
The PULTEGROUP INC. price is 52.97 USD. On the day, this instrument gained +0.67% with the lowest point at 52.10 USD and the highest point at 53.02 USD. The deviation from the price is +1.67% for the low point and -0.09% for the high point.52.10
53.02
52.97
The Central Gaps scanner detects a bearish opening. A small advantage for sellers in the very short term.
Bearish opening
Type : Bearish
Timeframe : Openning
Here is a more detailed summary of the historical variations registered by PULTEGROUP INC.:
Near a new HIGH record (1 year)
Type : Bullish
Timeframe : Weekly
New HIGH record (1st january)
Type : Bullish
Timeframe : Weekly
New HIGH record (1 month)
Type : Bullish
Timeframe : Weekly
Technical
Technical analysis of PULTEGROUP INC. in 1H shows a strongly overall bullish trend. 92.86% of the signals given by moving averages are bullish. This strongly bullish trend is supported by the strong bullish signals given by short-term moving averages. The Central Indicators market scanner currently does not detect any result that concerns moving averages.
In fact, according to the parameters integrated into the Central Analyzer system, 14 technical indicators out of 18 analysed are currently bullish. No additional result has been identified by Central Indicators, the scanner specialised in technical indicators.
The analysis of the price chart with Central Patterns scanners does not return any result.
For a small rebound in the very short term, the Central Candlesticks scanner currently notes the presence of this bullish pattern in Japanese candlesticks:
Bullish engulfing lines
Type : Bullish
Timeframe : 1 hour
ProTrendLines
S3
S2
S1
R1
R2
R3
Price
| S3 | S2 | S1 | Price | R1 | R2 | R3 | |
|---|---|---|---|---|---|---|---|
| ProTrendLines | 47.05 | 49.47 | 52.28 | 52.97 | 52.99 | 56.85 | 60.99 |
| Change (%) | -11.18% | -6.61% | -1.30% | - | +0.04% | +7.32% | +15.14% |
| Change | -5.92 | -3.50 | -0.69 | - | +0.02 | +3.88 | +8.02 |
| Level | Intermediate | Minor | Minor | - | Intermediate | Minor | Major |
Attention could also be paid to pivot points to set price objectives:
Daily
| Pivot points | S3 | S2 | S1 | PP | R1 | R2 | R3 |
|---|---|---|---|---|---|---|---|
| Standard | 50.79 | 51.39 | 52.00 | 52.60 | 53.21 | 53.81 | 54.42 |
| Camarilla | 52.29 | 52.40 | 52.51 | 52.62 | 52.73 | 52.84 | 52.95 |
| Woodie | 50.81 | 51.39 | 52.02 | 52.60 | 53.23 | 53.81 | 54.44 |
| Fibonacci | 51.39 | 51.85 | 52.13 | 52.60 | 53.06 | 53.34 | 53.81 |
Weekly
| Pivot points | S3 | S2 | S1 | PP | R1 | R2 | R3 |
|---|---|---|---|---|---|---|---|
| Standard | 48.19 | 49.31 | 50.96 | 52.08 | 53.73 | 54.85 | 56.50 |
| Camarilla | 51.86 | 52.11 | 52.37 | 52.62 | 52.87 | 53.13 | 53.38 |
| Woodie | 48.47 | 49.44 | 51.24 | 52.21 | 54.01 | 54.98 | 56.78 |
| Fibonacci | 49.31 | 50.37 | 51.02 | 52.08 | 53.14 | 53.79 | 54.85 |
Monthly
| Pivot points | S3 | S2 | S1 | PP | R1 | R2 | R3 |
|---|---|---|---|---|---|---|---|
| Standard | 37.92 | 40.28 | 42.90 | 45.26 | 47.88 | 50.24 | 52.86 |
| Camarilla | 44.16 | 44.62 | 45.07 | 45.53 | 45.99 | 46.44 | 46.90 |
| Woodie | 38.06 | 40.35 | 43.04 | 45.33 | 48.02 | 50.31 | 53.00 |
| Fibonacci | 40.28 | 42.18 | 43.35 | 45.26 | 47.16 | 48.33 | 50.24 |
Numerical data
The following is the status of technical indicators and moving averages registered at the time this technical analysis was created:
Technical indicators
Moving averages
| RSI (14): | 65.19 | |
| MACD (12,26,9): | 0.3800 | |
| Directional Movement: | 11.68 | |
| AROON (14): | 78.57 | |
| DEMA (21): | 52.83 | |
| Parabolic SAR (0,02-0,02-0,2): | 51.82 | |
| Elder Ray (13): | 0.29 | |
| Super Trend (3,10): | 51.71 | |
| Zig ZAG (10): | 52.89 | |
| VORTEX (21): | 1.1300 | |
| Stochastique (14,3,5): | 76.24 | |
| TEMA (21): | 52.93 | |
| Williams %R (14): | -14.36 | |
| Chande Momentum Oscillator (20): | 1.08 | |
| Repulse (5,40,3): | 1.0900 | |
| ROCnROLL: | 1 | |
| TRIX (15,9): | 0.1000 | |
| Courbe Coppock: | 3.17 |
| MA7: | 51.90 | |
| MA20: | 49.90 | |
| MA50: | 46.73 | |
| MA100: | 43.06 | |
| MAexp7: | 52.72 | |
| MAexp20: | 52.33 | |
| MAexp50: | 51.64 | |
| MAexp100: | 50.60 | |
| Price / MA7: | +2.06% | |
| Price / MA20: | +6.15% | |
| Price / MA50: | +13.35% | |
| Price / MA100: | +23.01% | |
| Price / MAexp7: | +0.47% | |
| Price / MAexp20: | +1.22% | |
| Price / MAexp50: | +2.58% | |
| Price / MAexp100: | +4.68% |
Quotes :
-
15 min delayed data
-
Actions NYSE
News
The last news published on PULTEGROUP INC. at the time of the generation of this analysis was as follows:
- PulteGroup Board Completes Investigation into Code of Ethical Business Conduct Violations by Former Employee
- Pultegroup Announces Brandon Jones, Senior Vice President – Field Operations, to Leave the Company
- PulteGroup’s Fourth Quarter 2022 Earnings Release and Webcast Conference Call Scheduled for January 31, 2023
- Pulte Homes Opens New Community in Greater Boston
- PulteGroup Again Named a Best Workplaces for Parents™ by Great Place to Work®