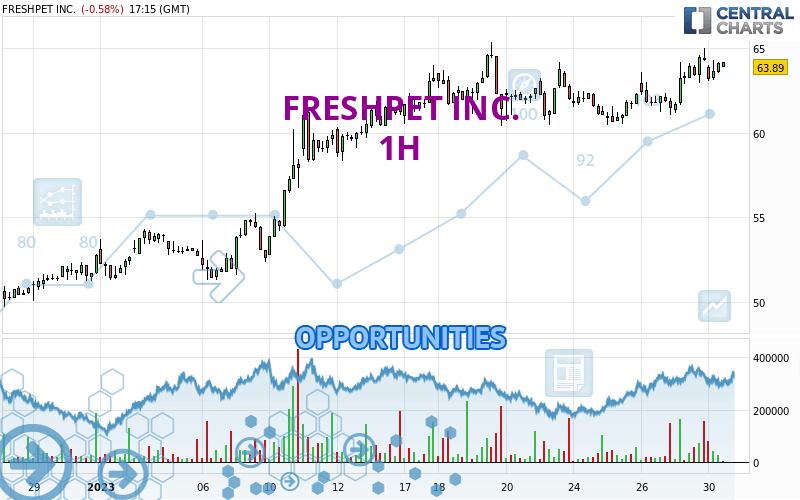
Londinia Opportunities Analyses - 01/30/2023 (GMT) FRESHPET INC. - 1H
- U.S. Stocks
- Timeframe : 1H
- - Analysis generated on
- Status : INVALID
Summary of the analysis
Trends
Short term:
Strongly bullish
Underlying:
Strongly bullish
Technical indicators
78%
6%
17%
My opinion
Bullish above 63.34 USD
My targets
66.03 USD (+2.95%)
69.30 USD (+8.04%)
My analysis
All elements being clearly bullish, it would be possible for traders to trade only long positions (at the time of purchase) on FRESHPET INC. as long as the price remains well above 63.34 USD. The buyers' bullish objective is set at 66.03 USD. A bullish break in this resistance would boost the bullish momentum. The buyers could then target the resistance located at 69.30 USD. If there is any crossing, the next objective would be the resistance located at 114.32 USD. However, beware of bullish excesses that could lead to a possible short-term correction; but this possible correction would not be tradeable.
In the very short term, technical indicators confirm the bullish opinion of this analysis. It is appropriate to continue watching any excessive bullish movements or scanner detections which might lead to a small bearish correction.
Force
0
10
8.4

Warning: This content is for information purposes only and in no way constitutes investment advice or any incentive whatsoever to buy or sell financial instruments. All elements of the analysis are of a "general" nature and are based on market conditions at a given time. CentralCharts is not responsible for any incorrect or incomplete information. Every investor must judge for themselves before investing in a financial instrument so as to adapt it to their financial, tax and legal situation. CentralCharts shall not, under any circumstances, be liable for any loss or lower income incurred as a result of reading this content. Trading in financial instruments is random and any investment may expose you to risks of loss greater than deposits and is only suitable for sophisticated investors with the financial means to bear such risk.
Additional analysis
Quotes
The FRESHPET INC. rating is 64.14 USD. On the day, this instrument lost -0.19% with the lowest point at 63.04 USD and the highest point at 64.26 USD. The deviation from the price is +1.74% for the low point and -0.19% for the high point.63.04
64.26
64.14
A bearish opening was detected by the Central Gaps scanner. Sellers are trying to impose a bearish trend in the very short term.
Bearish opening
Type : Bearish
Timeframe : Openning
Here is a more detailed summary of the historical variations registered by FRESHPET INC.:
Near a new HIGH record (1st january)
Type : Bullish
Timeframe : Weekly
Near a new HIGH record (1 month)
Type : Bullish
Timeframe : Weekly
Technical
A technical analysis in 1H of this FRESHPET INC. chart shows a strongly bullish trend. The signals given by the moving averages are 92.86% bullish. This strong bullish trend is confirmed by the strong signals currently being given by short-term moving averages. The Central Indicators market scanner currently does not detect any result that concerns moving averages.
In fact, 14 technical indicators on 18 studied are currently positioned bullish. The Central Indicators scanner specialised in technical indicators, has not detected anything further.
The analysis of the price chart with Central Patterns scanners does not return any result.
The presence of a bearish pattern in Japanese candlesticks detected by Central Candlesticks that could cause a correction in the very short term was also detected:
Bearish doji star
Type : Bearish
Timeframe : 1 hour
ProTrendLines
S3
S2
S1
R1
R2
R3
Price
| S3 | S2 | S1 | Price | R1 | R2 | R3 | |
|---|---|---|---|---|---|---|---|
| ProTrendLines | 54.33 | 60.44 | 63.34 | 64.14 | 69.30 | 114.32 | 158.53 |
| Change (%) | -15.29% | -5.77% | -1.25% | - | +8.04% | +78.24% | +147.16% |
| Change | -9.81 | -3.70 | -0.80 | - | +5.16 | +50.18 | +94.39 |
| Level | Minor | Intermediate | Major | - | Intermediate | Intermediate | Minor |
Attention could also be paid to pivot points to set price objectives:
Daily
| Pivot points | S3 | S2 | S1 | PP | R1 | R2 | R3 |
|---|---|---|---|---|---|---|---|
| Standard | 58.09 | 59.63 | 61.94 | 63.48 | 65.79 | 67.33 | 69.64 |
| Camarilla | 63.20 | 63.55 | 63.91 | 64.26 | 64.61 | 64.97 | 65.32 |
| Woodie | 58.49 | 59.82 | 62.34 | 63.67 | 66.19 | 67.52 | 70.04 |
| Fibonacci | 59.63 | 61.10 | 62.01 | 63.48 | 64.95 | 65.86 | 67.33 |
Weekly
| Pivot points | S3 | S2 | S1 | PP | R1 | R2 | R3 |
|---|---|---|---|---|---|---|---|
| Standard | 56.91 | 58.68 | 61.47 | 63.24 | 66.03 | 67.80 | 70.59 |
| Camarilla | 63.01 | 63.42 | 63.84 | 64.26 | 64.68 | 65.10 | 65.51 |
| Woodie | 57.42 | 58.94 | 61.98 | 63.50 | 66.54 | 68.06 | 71.10 |
| Fibonacci | 58.68 | 60.42 | 61.50 | 63.24 | 64.98 | 66.06 | 67.80 |
Monthly
| Pivot points | S3 | S2 | S1 | PP | R1 | R2 | R3 |
|---|---|---|---|---|---|---|---|
| Standard | 27.05 | 38.16 | 45.47 | 56.58 | 63.89 | 75.00 | 82.31 |
| Camarilla | 47.71 | 49.39 | 51.08 | 52.77 | 54.46 | 56.15 | 57.84 |
| Woodie | 25.14 | 37.21 | 43.56 | 55.63 | 61.98 | 74.05 | 80.40 |
| Fibonacci | 38.16 | 45.20 | 49.55 | 56.58 | 63.62 | 67.97 | 75.00 |
Numerical data
The following is the status of technical indicators and moving averages registered at the time this technical analysis was created:
Technical indicators
Moving averages
| RSI (14): | 60.28 | |
| MACD (12,26,9): | 0.5800 | |
| Directional Movement: | 9.65 | |
| AROON (14): | 50.00 | |
| DEMA (21): | 63.75 | |
| Parabolic SAR (0,02-0,02-0,2): | 62.53 | |
| Elder Ray (13): | 0.76 | |
| Super Trend (3,10): | 61.73 | |
| Zig ZAG (10): | 64.14 | |
| VORTEX (21): | 1.1800 | |
| Stochastique (14,3,5): | 73.64 | |
| TEMA (21): | 64.13 | |
| Williams %R (14): | -21.66 | |
| Chande Momentum Oscillator (20): | 2.28 | |
| Repulse (5,40,3): | 0.4800 | |
| ROCnROLL: | 1 | |
| TRIX (15,9): | 0.1000 | |
| Courbe Coppock: | 6.38 |
| MA7: | 62.57 | |
| MA20: | 59.06 | |
| MA50: | 58.97 | |
| MA100: | 56.56 | |
| MAexp7: | 63.77 | |
| MAexp20: | 62.95 | |
| MAexp50: | 62.23 | |
| MAexp100: | 60.75 | |
| Price / MA7: | +2.51% | |
| Price / MA20: | +8.60% | |
| Price / MA50: | +8.77% | |
| Price / MA100: | +13.40% | |
| Price / MAexp7: | +0.58% | |
| Price / MAexp20: | +1.89% | |
| Price / MAexp50: | +3.07% | |
| Price / MAexp100: | +5.58% |
Quotes :
-
15 min delayed data
-
Actions NASDAQ
News
The last news published on FRESHPET INC. at the time of the generation of this analysis was as follows:
- Freshpet® is honored to receive the annual partnership award from Walmart
- Freshpet Announces Employee Stock Ownership Program For Full-Time Hourly Team Members
- Kaskela Law LLC Announces Investigation of Freshpet, Inc. on Behalf of Current Stockholders
- FRESHPET INVESTIGATION INITIATED BY FORMER LOUISIANA ATTORNEY GENERAL: Kahn Swick & Foti, LLC Investigates the Officers and Directors of Freshpet, Inc. - FRPT
- Schubert Law Firm Investigates Freshpet, Inc. Executives for Potential Breaches of Fiduciary Duties