Londinia Opportunities Analyses - 03/17/2023 (GMT) NU SKIN ENTERPRISES INC. - 1H
- U.S. Stocks
- Timeframe : 1H
- - Analysis generated on
- Status : INVALID
Summary of the analysis
Trends
Short term:
Strongly bearish
Underlying:
Strongly bearish
Technical indicators
11%
78%
11%
My opinion
Bearish under 38.62 USD
My targets
37.71 USD (-1.54%)
36.27 USD (-5.30%)
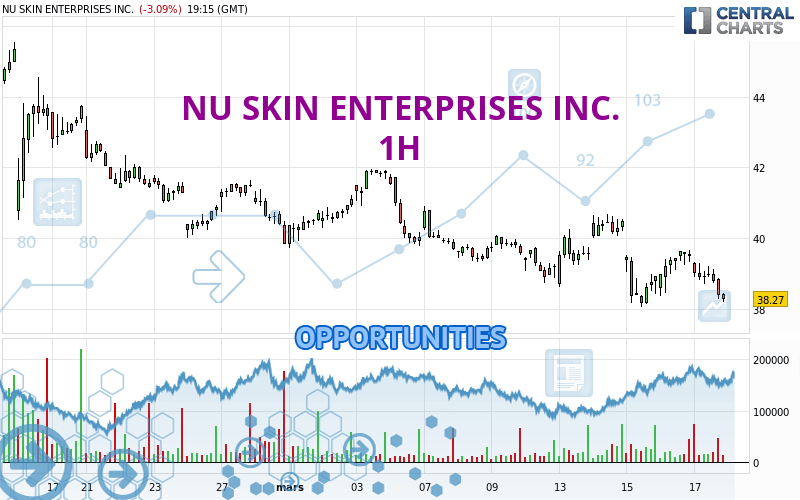
My analysis
The bearish trend is currently very strong for NU SKIN ENTERPRISES INC.. As long as the price remains below the resistance at 38.62 USD, you could try to take advantage of the bearish rally. The first bearish objective is located at 37.71 USD. The bearish momentum would be revived by a break in this support. Sellers would then use the next support located at 36.27 USD as an objective. Crossing it would then enable sellers to target 32.73 USD. Be careful, given the powerful bearish rally underway, excesses could lead to a short-term rebound. If this is the case, remember that trading against the trend may be riskier. It would seem more appropriate to wait for a signal indicating reversal of the trend.
Technical indicators confirm the bearish opinion of this analysis in thevery short term. However, be careful of excessive bearish movements. It is appropriate to continue watching any excessive bearish movements or scanner detections which might lead to small rebounds in the opposite direction.
Force
0
10
8.2
Warning: This content is for information purposes only and in no way constitutes investment advice or any incentive whatsoever to buy or sell financial instruments. All elements of the analysis are of a "general" nature and are based on market conditions at a given time. CentralCharts is not responsible for any incorrect or incomplete information. Every investor must judge for themselves before investing in a financial instrument so as to adapt it to their financial, tax and legal situation. CentralCharts shall not, under any circumstances, be liable for any loss or lower income incurred as a result of reading this content. Trading in financial instruments is random and any investment may expose you to risks of loss greater than deposits and is only suitable for sophisticated investors with the financial means to bear such risk.
Additional analysis
Quotes
The NU SKIN ENTERPRISES INC. price is 38.30 USD. On the day, this instrument lost -3.01% and was traded between 38.19 USD and 39.33 USD over the period. The price is currently at +0.29% from its lowest and -2.62% from its highest.38.19
39.33
38.30
The Central Gaps scanner detects a bearish opening. A small advantage for sellers in the very short term.
Bearish opening
Type : Bearish
Timeframe : Openning
A study of price movements over other periods shows the following variations:
Near a new LOW record (1st january)
Type : Bearish
Timeframe : Weekly
Near a new LOW record (1 month)
Type : Bearish
Timeframe : Weekly
Technical
Technical analysis of NU SKIN ENTERPRISES INC. in 1H shows a overall strongly bearish trend. The signals given by moving averages are 92.86% bearish. This strong bearish trend is confirmed by the strong signals currently being given by short-term moving averages. The Central Indicators scanner does not detect any result on moving averages that would impact this trend.
In fact, according to the parameters integrated into the Central Analyzer system, 14 technical indicators out of 18 analysed are currently bearish. But beware of excesses. The Central Indicators scanner currently detects this:
Williams %R indicator is oversold : under -80
Type : Neutral
Timeframe : 1 hour
Pivot points : price is under support 1
Type : Neutral
Timeframe : 1 hour
Parabolic SAR indicator bearish reversal
Type : Bearish
Timeframe : 1 hour
Central Patterns, the scanner specializing in chart patterns, did not identify any signals.
The Central Candlesticks scanner which studies Japanese candlesticks did not detect anything.
ProTrendLines
S3
S2
S1
R1
R2
R3
Price
| S3 | S2 | S1 | Price | R1 | R2 | R3 | |
|---|---|---|---|---|---|---|---|
| ProTrendLines | 32.73 | 36.27 | 37.71 | 38.30 | 38.62 | 39.33 | 40.26 |
| Change (%) | -14.54% | -5.30% | -1.54% | - | +0.84% | +2.69% | +5.12% |
| Change | -5.57 | -2.03 | -0.59 | - | +0.32 | +1.03 | +1.96 |
| Level | Minor | Minor | Major | - | Minor | Minor | Intermediate |
To determine price objectives, it is also possible to use the pivot points. Here is the price position in relation to pivot points:
Daily
| Pivot points | S3 | S2 | S1 | PP | R1 | R2 | R3 |
|---|---|---|---|---|---|---|---|
| Standard | 37.38 | 37.88 | 38.68 | 39.18 | 39.98 | 40.48 | 41.28 |
| Camarilla | 39.13 | 39.25 | 39.37 | 39.49 | 39.61 | 39.73 | 39.85 |
| Woodie | 37.54 | 37.96 | 38.84 | 39.26 | 40.14 | 40.56 | 41.44 |
| Fibonacci | 37.88 | 38.37 | 38.68 | 39.18 | 39.67 | 39.98 | 40.48 |
Weekly
| Pivot points | S3 | S2 | S1 | PP | R1 | R2 | R3 |
|---|---|---|---|---|---|---|---|
| Standard | 34.97 | 36.85 | 38.05 | 39.93 | 41.13 | 43.01 | 44.21 |
| Camarilla | 38.39 | 38.68 | 38.96 | 39.24 | 39.52 | 39.81 | 40.09 |
| Woodie | 34.62 | 36.68 | 37.70 | 39.76 | 40.78 | 42.84 | 43.86 |
| Fibonacci | 36.85 | 38.03 | 38.76 | 39.93 | 41.11 | 41.84 | 43.01 |
Monthly
| Pivot points | S3 | S2 | S1 | PP | R1 | R2 | R3 |
|---|---|---|---|---|---|---|---|
| Standard | 32.80 | 36.32 | 38.08 | 41.60 | 43.36 | 46.88 | 48.64 |
| Camarilla | 38.39 | 38.87 | 39.36 | 39.84 | 40.32 | 40.81 | 41.29 |
| Woodie | 31.92 | 35.88 | 37.20 | 41.16 | 42.48 | 46.44 | 47.76 |
| Fibonacci | 36.32 | 38.34 | 39.58 | 41.60 | 43.62 | 44.86 | 46.88 |
Numerical data
The following is the status of the technical indicators and moving averages at the time of publication of this technical analysis:
Technical indicators
Moving averages
| RSI (14): | 35.21 | |
| MACD (12,26,9): | -0.2300 | |
| Directional Movement: | -13.56 | |
| AROON (14): | -42.86 | |
| DEMA (21): | 38.75 | |
| Parabolic SAR (0,02-0,02-0,2): | 39.64 | |
| Elder Ray (13): | -0.52 | |
| Super Trend (3,10): | 39.74 | |
| Zig ZAG (10): | 38.33 | |
| VORTEX (21): | 0.8500 | |
| Stochastique (14,3,5): | 13.44 | |
| TEMA (21): | 38.63 | |
| Williams %R (14): | -100.00 | |
| Chande Momentum Oscillator (20): | -0.99 | |
| Repulse (5,40,3): | -2.0900 | |
| ROCnROLL: | 2 | |
| TRIX (15,9): | -0.0600 | |
| Courbe Coppock: | 0.60 |
| MA7: | 39.35 | |
| MA20: | 40.37 | |
| MA50: | 41.76 | |
| MA100: | 40.33 | |
| MAexp7: | 38.70 | |
| MAexp20: | 39.04 | |
| MAexp50: | 39.41 | |
| MAexp100: | 39.96 | |
| Price / MA7: | -2.67% | |
| Price / MA20: | -5.13% | |
| Price / MA50: | -8.29% | |
| Price / MA100: | -5.03% | |
| Price / MAexp7: | -1.03% | |
| Price / MAexp20: | -1.90% | |
| Price / MAexp50: | -2.82% | |
| Price / MAexp100: | -4.15% |
Quotes :
-
15 min delayed data
-
Actions NYSE
News
Don't forget to follow the news on NU SKIN ENTERPRISES INC.. At the time of publication of this analysis, the latest news was as follows:
- Nu Skin Enterprises Reports Fourth Quarter and 2022 Financial Results
- Nu Skin Enterprises Announces Dividend Increase for 22nd Consecutive Year
- Nu Skin Reaches 800 Million Meals Purchased and Donated in its Fight Against Child Malnutrition
- Nu Skin Enterprises to Announce Fourth Quarter and 2022 Financial Results
- Nu Skin Scientists Present Studies at Annual Meeting of the Society of Cosmetic Chemists