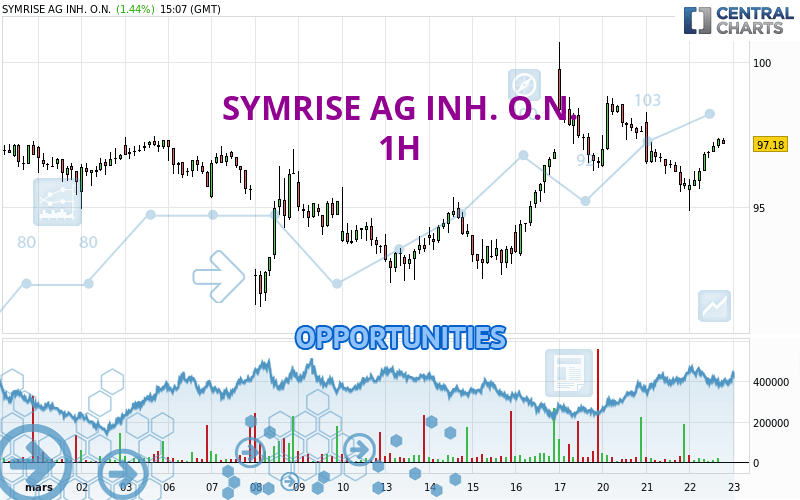
Londinia Opportunities Analyses - 03/22/2023 (GMT) SYMRISE AG INH. O.N. - 1H
-
EUR
(-)
-
15 min delayed data - Germany Stocks
| Type: | Stocks |
| Ticker: | SY1 |
| ISIN: | DE000SYM9999 |
I am delighted to see that my first price objective has been achieved. I hope you've taken advantage of it.
- Europe Stocks
- Timeframe : 1H
- - Analysis generated on
- Status : TARGET REACHED
Summary of the analysis
Trends
Short term:
Bullish
Underlying:
Strongly bullish
Technical indicators
78%
6%
17%
My opinion
Bullish above 96.44 EUR
My targets
98.01 EUR (+0.81%)
99.18 EUR (+2.02%)
My analysis
The basic bullish trend is very strong on SYMRISE AG INH. O.N. but the short term shows some signs of running out of steam. However, a purchase could be considered as long as the price remains above 96.44 EUR. Crossing the first resistance at 98.01 EUR would be a sign of a potential new surge in the price. Buyers would then use the next resistance located at 99.18 EUR as an objective. Crossing it would then enable buyers to target 100.70 EUR. Caution, a return to below 96.44 EUR would be a sign of a consolidation phase in the short-term basic trend. If this is the case, remember that trading against the trend may be riskier. It would seem more appropriate to wait for a signal indicating reversal of the trend.
Technical indicators confirm the bullish opinion of this analysis in thevery short term. However, be careful of excessive bullish movements. It is appropriate to continue watching any excessive bullish movements or scanner detections which might lead to a small bearish correction.
Force
0
10
7.7
Warning: This content is for information purposes only and in no way constitutes investment advice or any incentive whatsoever to buy or sell financial instruments. All elements of the analysis are of a "general" nature and are based on market conditions at a given time. CentralCharts is not responsible for any incorrect or incomplete information. Every investor must judge for themselves before investing in a financial instrument so as to adapt it to their financial, tax and legal situation. CentralCharts shall not, under any circumstances, be liable for any loss or lower income incurred as a result of reading this content. Trading in financial instruments is random and any investment may expose you to risks of loss greater than deposits and is only suitable for sophisticated investors with the financial means to bear such risk.
Additional analysis
Quotes
The SYMRISE AG INH. O.N. rating is 97.22 EUR. On the day, this instrument gained +1.48% with the lowest point at 94.86 EUR and the highest point at 97.36 EUR. The deviation from the price is +2.49% for the low point and -0.14% for the high point.94.86
97.36
97.22
The Central Gaps scanner detects a bearish opening. A small advantage for sellers in the very short term.
Bearish opening
Type : Bearish
Timeframe : Openning
A study of price movements over other periods shows the following variations:
Near a new LOW record (1 year)
Type : Bearish
Timeframe : Weekly
Near a new LOW record (1st january)
Type : Bearish
Timeframe : Weekly
Near a new HIGH record (1 month)
Type : Bullish
Timeframe : Weekly
Technical
A technical analysis in 1H of this SYMRISE AG INH. O.N. chart shows a strongly bullish trend. 89.29% of the signals given by moving averages are bullish. The slightly bullish signals given by the short-term moving averages show a weakening of the global trend. There is no crossing of moving average by the price or crossing of moving averages between themselves.
In fact, according to the parameters integrated into the Central Analyzer system, 14 technical indicators out of 18 analysed are currently bullish. Caution: the Central Indicators scanner currently detects an excess:
Williams %R indicator is overbought : over -20
Type : Neutral
Timeframe : 1 hour
Aroon indicator bullish trend
Type : Bullish
Timeframe : 1 hour
MACD indicator is back over 0
Type : Bullish
Timeframe : 1 hour
Price is back over the pivot point
Type : Bullish
Timeframe : Weekly
Central Patterns, the market scanner focusing on chart patterns, resistances and supports found this result:
Near resistance of channel
Type : Bearish
Timeframe : 1 hour
Central Candlesticks, the scanner specialised in Japanese candlesticks, detects these signals that could have an impact on the current short-term trend:
Bearish harami
Type : Bearish
Timeframe : 1 hour
Doji
Type : Neutral
Timeframe : 1 hour
ProTrendLines
S3
S2
S1
R1
R2
R3
Price
| S3 | S2 | S1 | Price | R1 | R2 | R3 | |
|---|---|---|---|---|---|---|---|
| ProTrendLines | 92.34 | 94.63 | 96.44 | 97.22 | 97.24 | 98.01 | 99.18 |
| Change (%) | -5.02% | -2.66% | -0.80% | - | +0.02% | +0.81% | +2.02% |
| Change | -4.88 | -2.59 | -0.78 | - | +0.02 | +0.79 | +1.96 |
| Level | Intermediate | Major | Intermediate | - | Intermediate | Intermediate | Minor |
To determine price objectives, it is also possible to use the pivot points. Here is the price position in relation to pivot points:
Daily
| Pivot points | S3 | S2 | S1 | PP | R1 | R2 | R3 |
|---|---|---|---|---|---|---|---|
| Standard | 92.02 | 93.76 | 94.78 | 96.52 | 97.54 | 99.28 | 100.30 |
| Camarilla | 95.04 | 95.29 | 95.55 | 95.80 | 96.05 | 96.31 | 96.56 |
| Woodie | 91.66 | 93.58 | 94.42 | 96.34 | 97.18 | 99.10 | 99.94 |
| Fibonacci | 93.76 | 94.81 | 95.47 | 96.52 | 97.57 | 98.23 | 99.28 |
Weekly
| Pivot points | S3 | S2 | S1 | PP | R1 | R2 | R3 |
|---|---|---|---|---|---|---|---|
| Standard | 83.98 | 88.16 | 92.34 | 96.52 | 100.70 | 104.88 | 109.06 |
| Camarilla | 94.22 | 94.99 | 95.75 | 96.52 | 97.29 | 98.05 | 98.82 |
| Woodie | 83.98 | 88.16 | 92.34 | 96.52 | 100.70 | 104.88 | 109.06 |
| Fibonacci | 88.16 | 91.35 | 93.33 | 96.52 | 99.71 | 101.69 | 104.88 |
Monthly
| Pivot points | S3 | S2 | S1 | PP | R1 | R2 | R3 |
|---|---|---|---|---|---|---|---|
| Standard | 86.87 | 90.51 | 93.66 | 97.30 | 100.45 | 104.09 | 107.24 |
| Camarilla | 94.93 | 95.56 | 96.18 | 96.80 | 97.42 | 98.05 | 98.67 |
| Woodie | 86.62 | 90.39 | 93.41 | 97.18 | 100.20 | 103.97 | 106.99 |
| Fibonacci | 90.51 | 93.11 | 94.71 | 97.30 | 99.90 | 101.50 | 104.09 |
Numerical data
The following is the status of technical indicators and moving averages registered at the time this technical analysis was created:
Technical indicators
Moving averages
| RSI (14): | 56.43 | |
| MACD (12,26,9): | 0.0200 | |
| Directional Movement: | -0.15 | |
| AROON (14): | 42.86 | |
| DEMA (21): | 96.71 | |
| Parabolic SAR (0,02-0,02-0,2): | 94.91 | |
| Elder Ray (13): | 0.51 | |
| Super Trend (3,10): | 97.46 | |
| Zig ZAG (10): | 97.20 | |
| VORTEX (21): | 0.8900 | |
| Stochastique (14,3,5): | 82.64 | |
| TEMA (21): | 96.47 | |
| Williams %R (14): | -4.13 | |
| Chande Momentum Oscillator (20): | 0.46 | |
| Repulse (5,40,3): | 0.6500 | |
| ROCnROLL: | 1 | |
| TRIX (15,9): | 0.0000 | |
| Courbe Coppock: | 1.17 |
| MA7: | 95.92 | |
| MA20: | 95.97 | |
| MA50: | 98.00 | |
| MA100: | 101.93 | |
| MAexp7: | 96.74 | |
| MAexp20: | 96.65 | |
| MAexp50: | 96.30 | |
| MAexp100: | 95.95 | |
| Price / MA7: | +1.36% | |
| Price / MA20: | +1.30% | |
| Price / MA50: | -0.80% | |
| Price / MA100: | -4.62% | |
| Price / MAexp7: | +0.50% | |
| Price / MAexp20: | +0.59% | |
| Price / MAexp50: | +0.96% | |
| Price / MAexp100: | +1.32% |
Quotes :
-
15 min delayed data
-
Actions Allemagne
News
The latest news and videos published on SYMRISE AG INH. O.N. at the time of the analysis were as follows:
- EQS-News: Symrise AG: Symrise 2022 again with strong growth and good profitability
- EQS-News: Symrise AG expands its Executive Board
- EQS-Adhoc: Symrise AG: Preliminary financial results for the 2022 fiscal year
- EQS-News: Symrise AG: Following a strong third quarter, Symrise again raises forecast for the year as a whole
- DGAP-News: Symrise achieves strong sales growth in the first half of 2022