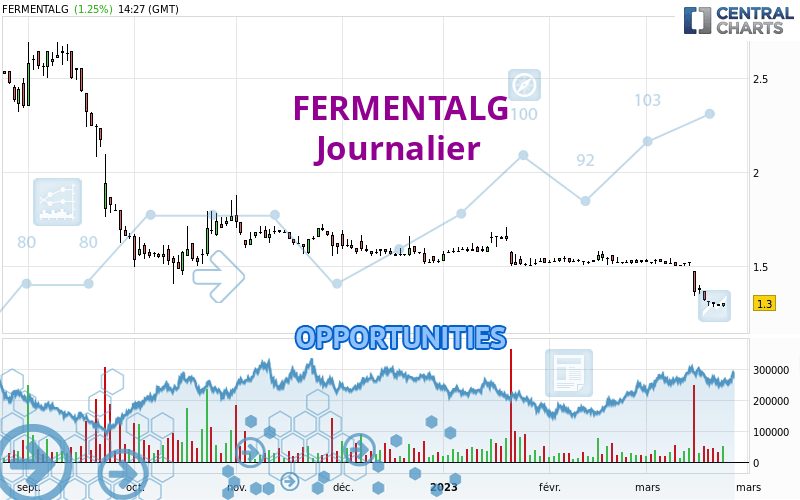
Londinia Opportunities Analyses - 03/23/2023 (GMT) FERMENTALG - Daily
-
EUR
(-)
-
15 min delayed data - Euronext Paris
| Type: | Stocks |
| Ticker: | ALGAE |
| ISIN: | FR0011271600 |
I am delighted to see that my first price objective has been achieved. I hope you've taken advantage of it.
- Europe Stocks
- Timeframe : Daily
- - Analysis generated on
- Status : TARGET REACHED
Summary of the analysis
Trends
Short term:
Strongly bearish
Underlying:
Strongly bearish
Technical indicators
11%
78%
11%
My opinion
Bearish under 1.413 EUR
My targets
1.173 EUR (-9.77%)
1.036 EUR (-20.31%)
My analysis
All elements being clearly bearish, it would be possible for traders to trade only short positions (for sale) on FERMENTALG as long as the price remains well below 1.413 EUR. The sellers' bearish objective is set at 1.173 EUR. A bearish break of this support would revive the bearish momentum. The sellers could then target the support located at 1.036 EUR. In case of crossing, the next objective would be the support located at 0.860 EUR. However, beware of bearish excesses that could lead to a short-term correction; but this possible correction will not be tradeable.
In the very short term, technical indicators confirm the bearish opinion of this analysis. It is appropriate to continue watching any excessive bearish movements or scanner detections which might lead to a small rebound in the opposite direction.
Force
0
10
8.2

Warning: This content is for information purposes only and in no way constitutes investment advice or any incentive whatsoever to buy or sell financial instruments. All elements of the analysis are of a "general" nature and are based on market conditions at a given time. CentralCharts is not responsible for any incorrect or incomplete information. Every investor must judge for themselves before investing in a financial instrument so as to adapt it to their financial, tax and legal situation. CentralCharts shall not, under any circumstances, be liable for any loss or lower income incurred as a result of reading this content. Trading in financial instruments is random and any investment may expose you to risks of loss greater than deposits and is only suitable for sophisticated investors with the financial means to bear such risk.
Additional analysis
Quotes
FERMENTALG rating 1.300 EUR. The price has increased by +1.25% since the last closing and was between 1.280 EUR and 1.300 EUR. This implies that the price is at +1.56% from its lowest and at 0% from its highest.1.280
1.300
1.300
Here is a more detailed summary of the historical variations registered by FERMENTALG:
New LOW record (1 year)
Type : Bearish
Timeframe : Weekly
New LOW record (1st january)
Type : Bearish
Timeframe : Weekly
New LOW record (1 month)
Type : Bearish
Timeframe : Weekly
Technical
A technical analysis in Journalier of this FERMENTALG chart shows a sharp bearish trend. 92.86% of the signals given by moving averages are bearish. This strongly bearish trend is supported by the strong bearish signals given by short-term moving averages. There is no crossing of moving average by the price or crossing of moving averages between themselves.
The probability of a further decline is high given the direction of the technical indicators.
Caution: the Central Indicators scanner currently detects an excess:
CCI indicator is oversold : under -100
Type : Neutral
Timeframe : Daily
Williams %R indicator is oversold : under -80
Type : Neutral
Timeframe : Daily
Pivot points : price is over resistance 1
Type : Neutral
Timeframe : Daily
The Central Patterns scanner, which studies chart patterns, resistances and supports, has identified this signal:
Support of channel is broken
Type : Bearish
Timeframe : Daily
No result was found by the Central Candlesticks scanner on Japanese candlesticks.
ProTrendLines
S1
R1
R2
R3
Price
| S1 | Price | R1 | R2 | R3 | |
|---|---|---|---|---|---|
| ProTrendLines | 0.860 | 1.300 | 1.486 | 1.910 | 2.051 |
| Change (%) | -33.85% | - | +14.31% | +46.92% | +57.77% |
| Change | -0.440 | - | +0.186 | +0.610 | +0.751 |
| Level | Major | - | Intermediate | Minor | Minor |
To determine price objectives, it is also possible to use the pivot points. Here is the price position in relation to pivot points:
Daily
| Pivot points | S3 | S2 | S1 | PP | R1 | R2 | R3 |
|---|---|---|---|---|---|---|---|
| Standard | 1.265 | 1.275 | 1.279 | 1.289 | 1.293 | 1.303 | 1.307 |
| Camarilla | 1.280 | 1.281 | 1.283 | 1.284 | 1.285 | 1.287 | 1.288 |
| Woodie | 1.263 | 1.274 | 1.277 | 1.288 | 1.291 | 1.302 | 1.305 |
| Fibonacci | 1.275 | 1.280 | 1.283 | 1.289 | 1.294 | 1.297 | 1.303 |
Weekly
| Pivot points | S3 | S2 | S1 | PP | R1 | R2 | R3 |
|---|---|---|---|---|---|---|---|
| Standard | 1.036 | 1.173 | 1.246 | 1.383 | 1.456 | 1.593 | 1.666 |
| Camarilla | 1.261 | 1.281 | 1.300 | 1.319 | 1.338 | 1.358 | 1.377 |
| Woodie | 1.004 | 1.157 | 1.214 | 1.367 | 1.424 | 1.577 | 1.634 |
| Fibonacci | 1.173 | 1.253 | 1.303 | 1.383 | 1.463 | 1.513 | 1.593 |
Monthly
| Pivot points | S3 | S2 | S1 | PP | R1 | R2 | R3 |
|---|---|---|---|---|---|---|---|
| Standard | 1.413 | 1.458 | 1.490 | 1.535 | 1.567 | 1.612 | 1.644 |
| Camarilla | 1.501 | 1.508 | 1.515 | 1.522 | 1.529 | 1.536 | 1.543 |
| Woodie | 1.407 | 1.455 | 1.484 | 1.532 | 1.561 | 1.609 | 1.638 |
| Fibonacci | 1.458 | 1.487 | 1.506 | 1.535 | 1.564 | 1.583 | 1.612 |
Numerical data
The following are the details of the technical indicators and moving averages that were collected to generate this technical analysis:
Technical indicators
Moving averages
| RSI (14): | 20.63 | |
| MACD (12,26,9): | -0.0620 | |
| Directional Movement: | -31.534 | |
| AROON (14): | -64.285 | |
| DEMA (21): | 1.345 | |
| Parabolic SAR (0,02-0,02-0,2): | 1.491 | |
| Elder Ray (13): | -0.092 | |
| Super Trend (3,10): | 1.391 | |
| Zig ZAG (10): | 1.299 | |
| VORTEX (21): | 0.6380 | |
| Stochastique (14,3,5): | 5.26 | |
| TEMA (21): | 1.304 | |
| Williams %R (14): | -92.69 | |
| Chande Momentum Oscillator (20): | -0.211 | |
| Repulse (5,40,3): | -0.7470 | |
| ROCnROLL: | 2 | |
| TRIX (15,9): | -0.3670 | |
| Courbe Coppock: | 24.52 |
| MA7: | 1.320 | |
| MA20: | 1.447 | |
| MA50: | 1.504 | |
| MA100: | 1.553 | |
| MAexp7: | 1.334 | |
| MAexp20: | 1.416 | |
| MAexp50: | 1.488 | |
| MAexp100: | 1.594 | |
| Price / MA7: | -1.52% | |
| Price / MA20: | -10.16% | |
| Price / MA50: | -13.56% | |
| Price / MA100: | -16.29% | |
| Price / MAexp7: | -2.55% | |
| Price / MAexp20: | -8.19% | |
| Price / MAexp50: | -12.63% | |
| Price / MAexp100: | -18.44% |
Quotes :
-
15 min delayed data
-
Euronext Paris
News
Don't forget to follow the news on FERMENTALG. At the time of publication of this analysis, the latest news was as follows:
- Fermentalg strengthens its cash position through a EUR6.3 million bond issue with four European investors, to boost its development plan
- 2023 Financial Agenda
- Fermentalg committed to the " Food needs of Tomorrow " with the support of Bpifrance
- Industrial production and first order for the new natural blue food colorant
- Sales of EUR 6.2 million at the end of September 2022, up 67% compared to 2021