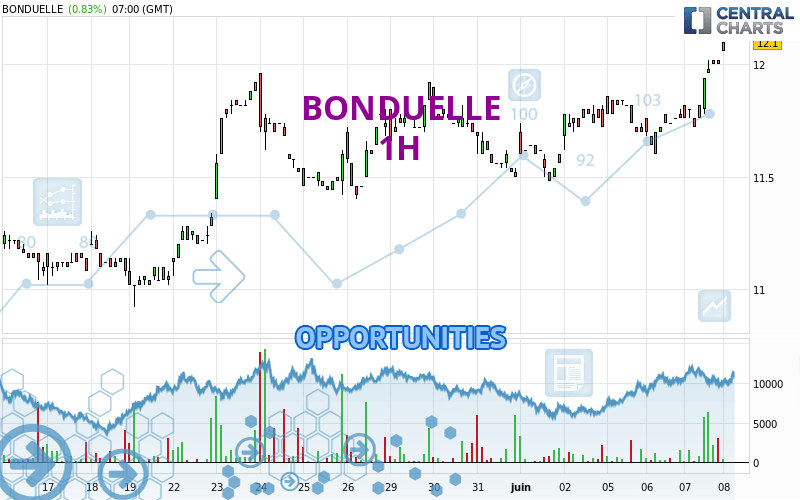
Londinia Opportunities Analyses - 06/08/2023 (GMT) BONDUELLE - 1H
-
EUR
(-)
-
15 min delayed data - Euronext Paris
| Type: | Stocks |
| Ticker: | BON |
| ISIN: | FR0000063935 |
- Europe Stocks
- Timeframe : 1H
- - Analysis generated on
- Status : INVALID
Summary of the analysis
Trends
Short term:
Strongly bullish
Underlying:
Strongly bullish
Technical indicators
94%
0%
6%
My opinion
Bullish above 11.93 EUR
My targets
12.34 EUR (+1.98%)
12.81 EUR (+5.87%)
My analysis
BONDUELLE is part of a very strong bullish trend. Traders may consider trading only long positions (at the time of purchase) as long as the price remains well above 11.93 EUR. The next resistance located at 12.34 EUR is the next bullish objective to be reached. A bullish break in this resistance would boost the bullish momentum. The bullish movement could then continue towards the next resistance located at 12.81 EUR. After this resistance, buyers could then target 13.46 EUR. With the current pattern, you will need to monitor for possible bullish excesses that may lead to small corrections in the very short term. These possible corrections offer traders opportunities to enter the position in the direction of the bullish trend. Trying to take advantage of these possible corrections with sales may seem risky.
In the very short term, the general bullish sentiment is confirmed by technical indicators. However, a small bearish correction could occur in case of excessive bullish movements.
Force
0
10
9.1

Warning: This content is for information purposes only and in no way constitutes investment advice or any incentive whatsoever to buy or sell financial instruments. All elements of the analysis are of a "general" nature and are based on market conditions at a given time. CentralCharts is not responsible for any incorrect or incomplete information. Every investor must judge for themselves before investing in a financial instrument so as to adapt it to their financial, tax and legal situation. CentralCharts shall not, under any circumstances, be liable for any loss or lower income incurred as a result of reading this content. Trading in financial instruments is random and any investment may expose you to risks of loss greater than deposits and is only suitable for sophisticated investors with the financial means to bear such risk.
Additional analysis
Quotes
BONDUELLE rating 12.10 EUR. The price has increased by +0.83% since the last closing with the lowest point at 12.06 EUR and the highest point at 12.10 EUR. The deviation from the price is +0.33% for the low point and 0% for the high point.12.06
12.10
12.10
The Central Gaps scanner detects a bullish opening. A small advantage for buyers in the very short term.
Bullish opening
Type : Bullish
Timeframe : Openning
So that you have an overall view of the price change, here is a table showing the variations over several periods:
Technical
A technical analysis in 1H of this BONDUELLE chart shows a strongly bullish trend. 92.86% of the signals given by moving averages are bullish. The overall trend is supported by the strong bullish signals from short-term moving averages. There is no crossing of moving average by the price or crossing of moving averages between themselves.
In fact, 17 technical indicators on 18 studied are currently bullish. The Central Indicators scanner found no further results concerning independent technical indicators.
Central Patterns, the market scanner focusing on chart patterns, resistances and supports found these results:
Near resistance of channel
Type : Bearish
Timeframe : 1 hour
Near horizontal support
Type : Bullish
Timeframe : 1 hour
The Central Candlesticks scanner which studies Japanese candlesticks did not detect anything.
ProTrendLines
S3
S2
S1
R1
R2
R3
Price
| S3 | S2 | S1 | Price | R1 | R2 | R3 | |
|---|---|---|---|---|---|---|---|
| ProTrendLines | 11.51 | 11.72 | 11.93 | 12.10 | 12.34 | 12.81 | 13.46 |
| Change (%) | -4.88% | -3.14% | -1.40% | - | +1.98% | +5.87% | +11.24% |
| Change | -0.59 | -0.38 | -0.17 | - | +0.24 | +0.71 | +1.36 |
| Level | Intermediate | Minor | Major | - | Major | Minor | Minor |
Pivot points can also be used to set your price objectives. Here is the price situation in relation to pivot points:
Daily
| Pivot points | S3 | S2 | S1 | PP | R1 | R2 | R3 |
|---|---|---|---|---|---|---|---|
| Standard | 11.51 | 11.61 | 11.81 | 11.91 | 12.11 | 12.21 | 12.41 |
| Camarilla | 11.92 | 11.95 | 11.97 | 12.00 | 12.03 | 12.06 | 12.08 |
| Woodie | 11.55 | 11.64 | 11.85 | 11.94 | 12.15 | 12.24 | 12.45 |
| Fibonacci | 11.61 | 11.73 | 11.80 | 11.91 | 12.03 | 12.10 | 12.21 |
Weekly
| Pivot points | S3 | S2 | S1 | PP | R1 | R2 | R3 |
|---|---|---|---|---|---|---|---|
| Standard | 11.05 | 11.27 | 11.49 | 11.71 | 11.93 | 12.15 | 12.37 |
| Camarilla | 11.60 | 11.64 | 11.68 | 11.72 | 11.76 | 11.80 | 11.84 |
| Woodie | 11.06 | 11.27 | 11.50 | 11.71 | 11.94 | 12.15 | 12.38 |
| Fibonacci | 11.27 | 11.44 | 11.54 | 11.71 | 11.88 | 11.98 | 12.15 |
Monthly
| Pivot points | S3 | S2 | S1 | PP | R1 | R2 | R3 |
|---|---|---|---|---|---|---|---|
| Standard | 9.93 | 10.43 | 10.97 | 11.47 | 12.01 | 12.51 | 13.05 |
| Camarilla | 11.23 | 11.33 | 11.43 | 11.52 | 11.62 | 11.71 | 11.81 |
| Woodie | 9.96 | 10.44 | 11.00 | 11.48 | 12.04 | 12.52 | 13.08 |
| Fibonacci | 10.43 | 10.82 | 11.07 | 11.47 | 11.86 | 12.11 | 12.51 |
Numerical data
The following are the details of the technical indicators and moving averages that were collected to generate this technical analysis:
Technical indicators
Moving averages
| RSI (14): | 66.43 | |
| MACD (12,26,9): | 0.0600 | |
| Directional Movement: | 26.00 | |
| AROON (14): | 78.57 | |
| DEMA (21): | 11.90 | |
| Parabolic SAR (0,02-0,02-0,2): | 11.71 | |
| Elder Ray (13): | 0.15 | |
| Super Trend (3,10): | 11.82 | |
| Zig ZAG (10): | 12.00 | |
| VORTEX (21): | 0.9700 | |
| Stochastique (14,3,5): | 95.24 | |
| TEMA (21): | 11.94 | |
| Williams %R (14): | -4.76 | |
| Chande Momentum Oscillator (20): | 0.28 | |
| Repulse (5,40,3): | 0.4700 | |
| ROCnROLL: | 1 | |
| TRIX (15,9): | 0.0400 | |
| Courbe Coppock: | 3.14 |
| MA7: | 11.71 | |
| MA20: | 11.50 | |
| MA50: | 11.56 | |
| MA100: | 12.35 | |
| MAexp7: | 11.92 | |
| MAexp20: | 11.83 | |
| MAexp50: | 11.75 | |
| MAexp100: | 11.67 | |
| Price / MA7: | +3.33% | |
| Price / MA20: | +5.22% | |
| Price / MA50: | +4.67% | |
| Price / MA100: | -2.02% | |
| Price / MAexp7: | +1.51% | |
| Price / MAexp20: | +2.28% | |
| Price / MAexp50: | +2.98% | |
| Price / MAexp100: | +3.68% |
Quotes :
-
15 min delayed data
-
Euronext Paris
News
Don't forget to follow the news on BONDUELLE. At the time of publication of this analysis, the latest news was as follows:
- BONDUELLE - Monthly statement of the number of shares and voting rights
- BONDUELLE - Monthly statement of the number of shares and voting rights
- BONDUELLE - Monthly statement of the number of shares and voting rights
- Bonduelle - Statement of availability of the Half-Year Financial Report on December 31, 2022
- Bonduelle - First Half Year 2022-2023 Financial Results: Confirmation of revenue growth and profitability objectives